May 24, 2026 a 11:31 am
 📊
📊
📉
📈
 🗣️
🗣️
 ✅
✅
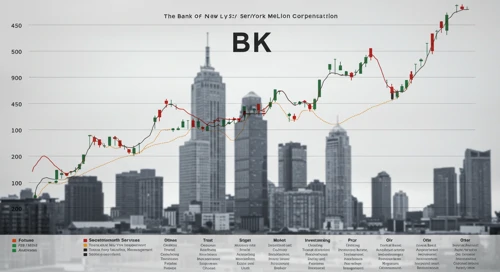
BK: Dividend Analysis - The Bank of New York Mellon Corporation
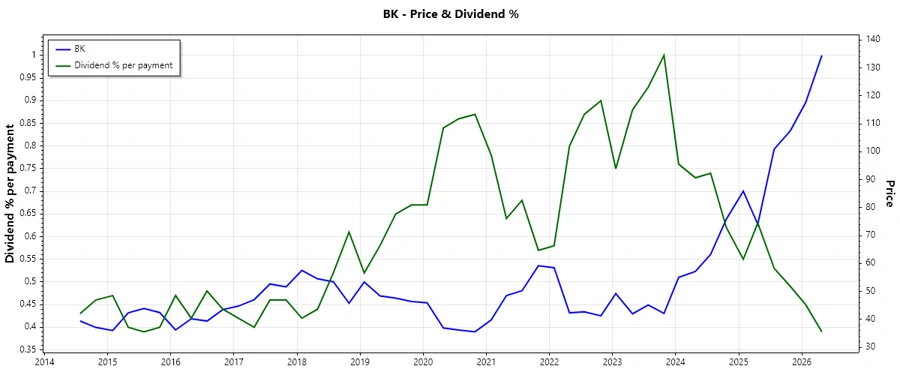
The Bank of New York Mellon Corporation (BK) is a well-established financial institution, renowned for its robust dividend policy and consistent shareholder returns. With an impressive dividend history spanning 42 years without recent cuts or suspensions, BK manifests a reliable dividend income stream for its investors. Its current dividend yield of 1.58% aligns with an ethos of stability and moderate growth, backed by disciplined payout practices. Despite its significantly high free cash flow payout ratio, the firm's earnings payout remains conservatively managed.
Overview
The Bank of New York Mellon has demonstrated a stable dividend profile characterized by continual payouts and moderate growth. Operating in the financial sector, the company yields a dividend of 1.58%, reflecting its strategy of sustainable payouts despite prevailing market challenges.
| Criteria | Details |
|---|---|
| Sector | Financial |
| Dividend yield | 1.58% |
| Current dividend per share | 2.39 USD |
| Dividend history | 42 years |
| Last cut or suspension | None |
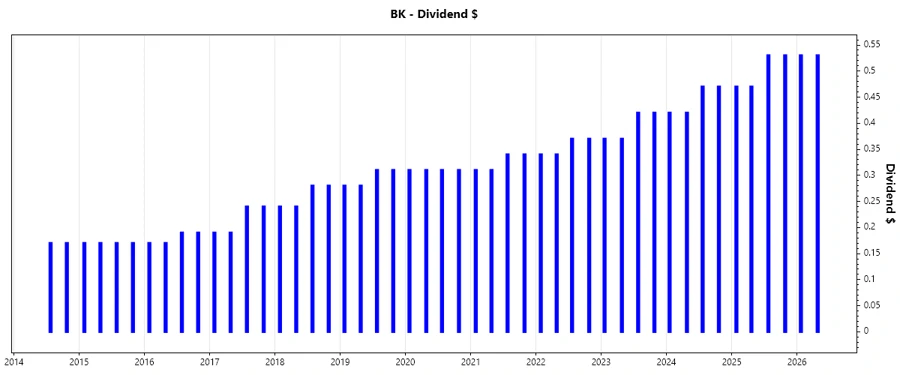
Dividend History
Understanding the historical trend of dividend payments is essential for assessing a company's commitment to returning capital to shareholders. The Bank of New York Mellon stands out with a consistent dividend track for over four decades, instilling confidence in its financial fortitude and commitment to shareholder value.
| Year | Dividend per Share (USD) |
|---|---|
| 2026 | 1.06 |
| 2025 | 2.00 |
| 2024 | 1.78 |
| 2023 | 1.58 |
| 2022 | 1.42 |
Dividend Growth
Analyzing dividend growth rates is crucial for investors seeking potential income increases. BK's three- and five-year growth rates point towards its endeavor for sustainable dividend enhancement.
| Time | Growth |
|---|---|
| 3 years | 12.09% |
| 5 years | 10.03% |
The average dividend growth is 10.03% over 5 years. This shows moderate but steady dividend growth, reinforcing the firm's strategy to deliver incremental value to its investors.
🗣️
Payout Ratio
The payout ratio gauges the proportion of earnings and cash flow distributed as dividends. Despite a high free cash flow payout at 112.79%, the EPS-based payout ratio remains conservative at 27.72%, implying earnings resilience and flexibility.
| Key figure | Ratio |
|---|---|
| EPS-based | 27.72% |
| Free cash flow-based | 112.79% |
The divergence between EPS and FCF payout ratios highlights the importance of monitoring cash flow adequacy to sustain ongoing dividend commitments.
Cashflow & Capital Efficiency
Efficient capital allocation and strong cash flow generation are pivotal for maintaining competitive advantage and shareholder returns.
| Year | 2023 | 2024 | 2025 |
|---|---|---|---|
| Free Cash Flow Yield | 11.50% | -1.37% | 6.33% |
| Earnings Yield | 8.09% | 7.94% | 6.78% |
| CAPEX to Operating Cash Flow | 20.64% | 213.83% | 23.08% |
| Stock-based Compensation to Revenue | 0% | 0% | 0% |
| Free Cash Flow / Operating Cash Flow Ratio | 79.36% | -113.83% | 76.92% |
Analyzing these ratios, BK’s cash flow profile suggests fluctuations yet reflects a trend towards capital efficiency, with high operating leverage being cautiously optimized to drive greater returns.
Balance Sheet & Leverage Analysis
A robust balance sheet underpins financial stability, optimizing gearing ratios to protect against volatility while ensuring flexible financial stewardship.
| Year | 2023 | 2024 | 2025 |
|---|---|---|---|
| Debt-to-Equity | 113.42% | 109.99% | 76.45% |
| Debt-to-Assets | 11.28% | 10.92% | 7.17% |
| Debt-to-Capital | 53.14% | 52.38% | 43.33% |
| Net Debt to EBITDA | -12.80 | -7.38 | -10.96 |
| Current Ratio | 0.78 | 0.65 | 0.70 |
| Quick Ratio | 0.78 | 0.65 | 0.70 |
| Financial Leverage | 10.05 | 10.07 | 10.66 |
The leverage metrics depict prudent management of obligations with sustainable debt levels and coverage capacity, reinforcing stability amidst dynamic financial landscapes.
Fundamental Strength & Profitability
Continual assessment of profitability and operational efficiency highlights BK’s capacity to generate returns in line with sectoral benchmarks.
| Year | 2023 | 2024 | 2025 |
|---|---|---|---|
| Return on Equity | 8.10% | 10.96% | 12.52% |
| Return on Assets | 0.81% | 1.09% | 1.17% |
| Margins: Net | 9.77% | 11.45% | 13.72% |
| Margins: EBIT | 12.67% | 14.79% | 17.45% |
| Margins: EBITDA | 18.26% | 19.34% | 22.03% |
| Margins: Gross | 51.40% | 45.98% | 48.94% |
| Research & Development to Revenue | 0% | 0% | 0% |
Your firm displays robust profitability metrics, though its R&D spend suggests a need for reinvestment strategies to safeguard competitive positioning in an evolving market environment.
Price Development
✅
Dividend Scoring System
| Criteria | Score | Score Bar |
|---|---|---|
| Dividend yield | 3 | |
| Dividend Stability | 5 | |
| Dividend growth | 3 | |
| Payout ratio | 4 | |
| Financial stability | 4 | |
| Dividend continuity | 5 | |
| Cashflow Coverage | 3 | |
| Balance Sheet Quality | 4 |
Total Score: 31/40
Rating
The Bank of New York Mellon Corporation's dividend profile is a testament to its resilient financial management and strategic foresight, suitable for investors seeking stable yields and moderate growth. Its consistent payout record coupled with manageable leverage ratios robustly positions it within the sector, deserving a solid hold recommendation.
Smart Data Insight
Master the Perfect Entry & Exit for this Stock
Don't leave your profits to chance. Historically, this stock follows specific seasonal patterns that institutional traders use to maximize returns.
- ✅ Identify the "Golden Buying Window"
- ✅ Avoid high-risk correction cycles
- ✅ Backtested data from the last 20+ years