April 13, 2026 a 11:31 am

BK: Dividend Analysis - The Bank of New York Mellon Corporation
The Bank of New York Mellon Corporation exhibits a robust dividend track record with 42 consecutive years of dividend payouts. A modest yet consistent dividend yield of 1.75% suggests reliability, though it may appeal more to conservative income investors. The recent dividend growth rate of 10% over five years indicates stable, if not spectacular, increases. The absence of any recent dividend cuts further solidifies its standing among income stocks.
📊 Overview
| Metric | Value |
|---|---|
| Sector | Financials |
| Dividend yield | 1.75 % |
| Current dividend per share | 2.39 USD |
| Dividend history | 42 years |
| Last cut or suspension | None |
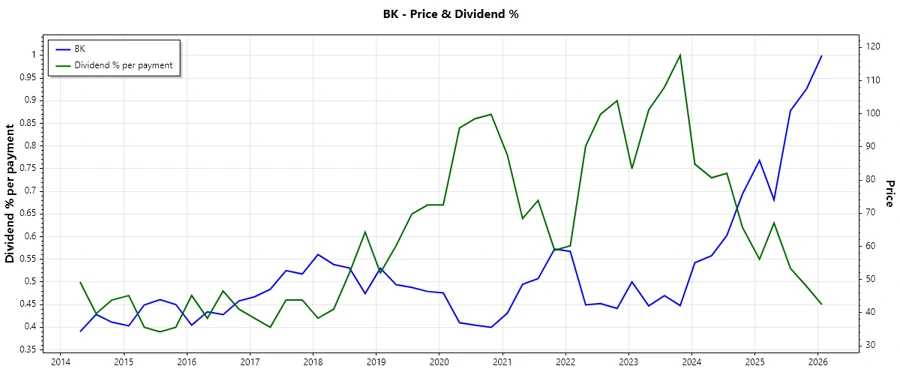
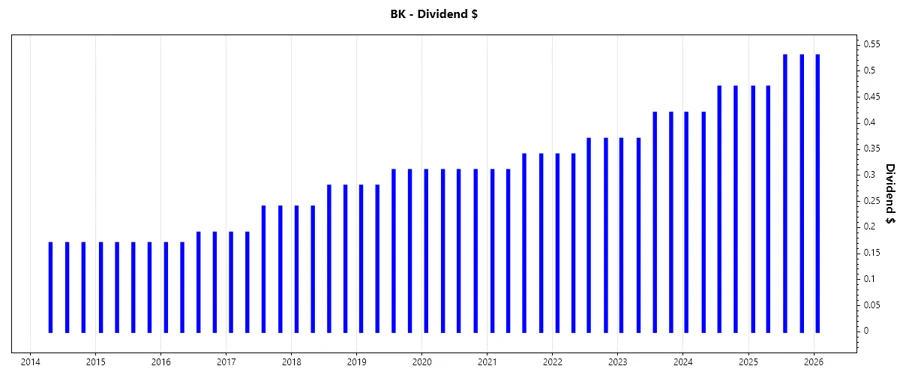
📈 Dividend History
The consistency of the dividend history over 42 years highlights the company's commitment to returning profits to shareholders even during economic downturns.
| Year | Dividend per Share (USD) |
|---|---|
| 2026 | 0.53 |
| 2025 | 2.00 |
| 2024 | 1.78 |
| 2023 | 1.58 |
| 2022 | 1.42 |
📈 Dividend Growth
Highlighting dividend growth rates is crucial as they indicate potential future dividends. The company's 3-year growth of 12.09% and 5-year growth of 10.03% suggest room for sustainable increases.
| Time | Growth |
|---|---|
| 3 years | 12.09 % |
| 5 years | 10.03 % |
The average dividend growth is 10.03% over 5 years. This shows moderate but steady dividend growth.
⚠️ Payout Ratio
Payout ratios provide insight into dividend sustainability. A sound payout ratio suggests that dividends are well-covered by earnings and free cash flow.
| Key Figure | Ratio |
|---|---|
| EPS-based | 30.37 % |
| Free cash flow-based | 32.21 % |
A 30.37% EPS payout ratio and 32.21% FCF payout ratio are favorable, indicating a conservative approach in meeting dividend obligations without overcommitting cash flow.
📊 Cashflow & Capital Efficiency
Understanding cash flows and capital efficiency metrics aids investors in assessing the operational effectiveness and cash management capabilities of a firm.
| Year | 2025 | 2024 | 2023 |
|---|---|---|---|
| Free Cash Flow Yield | 6.33% | -1.37% | 11.50% |
| Earnings Yield | 6.78% | 7.94% | 8.09% |
| CAPEX/Operating Cash Flow | 23.08% | 213.83% | 20.64% |
| Stock-based Compensation to Revenue | 0% | 0% | 0% |
| Free Cash Flow/Operating Cash Flow Ratio | 76.92% | -113.83% | 79.36% |
The cash flow and capital efficiency metrics exhibit resilience, especially in 2023 with a strong operational cash flow management, complementing dividend payouts.
📊 Balance Sheet & Leverage Analysis
Analyzing balance sheets and leverage ratios ensures the company maintains a manageable debt burden and liquidity levels to weather financial pressures.
| Year | 2025 | 2024 | 2023 |
|---|---|---|---|
| Debt-to-Equity | 0.76 | 1.10 | 1.13 |
| Debt-to-Assets | 0.07 | 0.11 | 0.11 |
| Debt-to-Capital | 0.43 | 0.52 | 0.53 |
| Net Debt to EBITDA | -10.96 | -7.38 | -12.80 |
| Current Ratio | 0.70 | 0.65 | 0.78 |
| Quick Ratio | 0.70 | 0.65 | 0.78 |
| Financial Leverage | 10.66 | 10.07 | 10.05 |
Despite leverage ratios indicating high leverage typical for banks, strong EBITDA capacity and liquidity metrics suggest The Bank of New York Mellon maintains stability while navigating its debt outlook.
📊 Fundamental Strength & Profitability
Key profitability metrics indicate the company's ability to generate income and reflect its financial health and operational efficiency.
| Year | 2025 | 2024 | 2023 |
|---|---|---|---|
| Return on Equity | 12.52% | 10.96% | 8.10% |
| Return on Assets | 1.17% | 1.09% | 0.81% |
| Net Margin | 13.72% | 11.45% | 9.77% |
| EBIT Margin | 17.45% | 14.79% | 12.67% |
| EBITDA Margin | 22.03% | 19.34% | 18.26% |
| Gross Margin | 48.94% | 45.98% | 51.40% |
Over recent years, profitability metrics demonstrate a solid capacity for value creation leveraging its core business operations effectively, implying a foundation for ongoing strengths in profitability in bank operations.
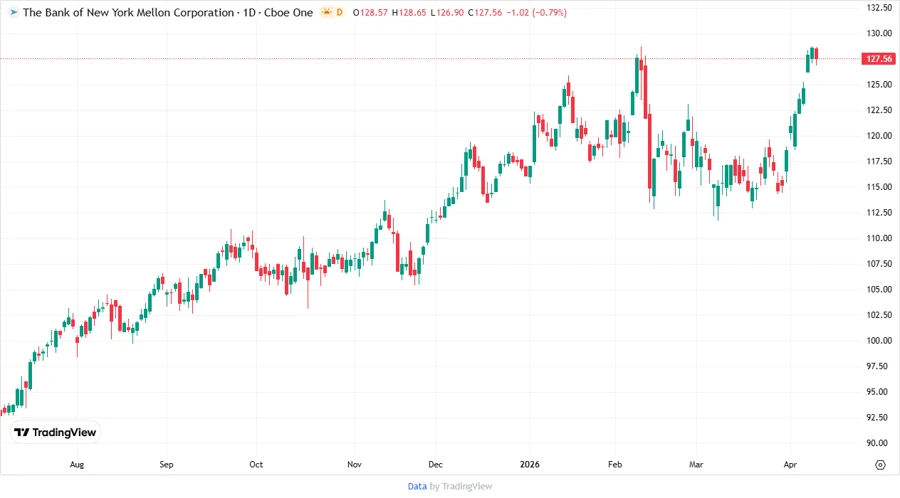
📈 Price Development
🗣️ Dividend Scoring System
| Category | Score | Rating |
|---|---|---|
| Dividend yield | 3 | |
| Dividend Stability | 5 | |
| Dividend growth | 4 | |
| Payout ratio | 4 | |
| Financial stability | 4 | |
| Dividend continuity | 5 | |
| Cashflow Coverage | 3 | |
| Balance Sheet Quality | 4 |
Total Score: 32/40
✅ Rating
The Bank of New York Mellon Corporation presents a strong dividend profile for conservative, income-focused investors. Its stable dividend history and moderate growth, coupled with a solid dividend payout ratio, make it a reliable choice. Though the dividend yield is not exceptionally high, it is compensated by commendable financial stability and robust profitability metrics. This investment is recommended for those seeking stable income with potential for moderate growth and minimal volatility in the financial sector.
Smart Data Insight
Master the Perfect Entry & Exit for this Stock
Don't leave your profits to chance. Historically, this stock follows specific seasonal patterns that institutional traders use to maximize returns.
- ✅ Identify the "Golden Buying Window"
- ✅ Avoid high-risk correction cycles
- ✅ Backtested data from the last 20+ years