October 21, 2025 a 07:31 am

BK: Dividend Analysis - The Bank of New York Mellon Corporation
The Bank of New York Mellon Corporation (BK) exhibits a steady track record with impressive dividend payouts, a robust financial position, and potential for moderate growth. Offering a sustained yield coupled with stable financial metrics, BK remains an attractive option for dividend-focused investors. With over 40 years of consecutive dividend history, BK is testament to enduring financial resilience.
📊 Overview
BK operates within the financial sector, characterized by a dividend yield of 1.84%, and a current dividend of 2.08 USD per share. With 41 years of consistent dividend history and no recent cuts since 2010, investors can anticipate stable payments.
| Metric | Value |
|---|---|
| Sector | Financial |
| Dividend yield | 1.84 % |
| Current dividend per share | 2.08 USD |
| Dividend history | 41 years |
| Last cut or suspension | 2010 |
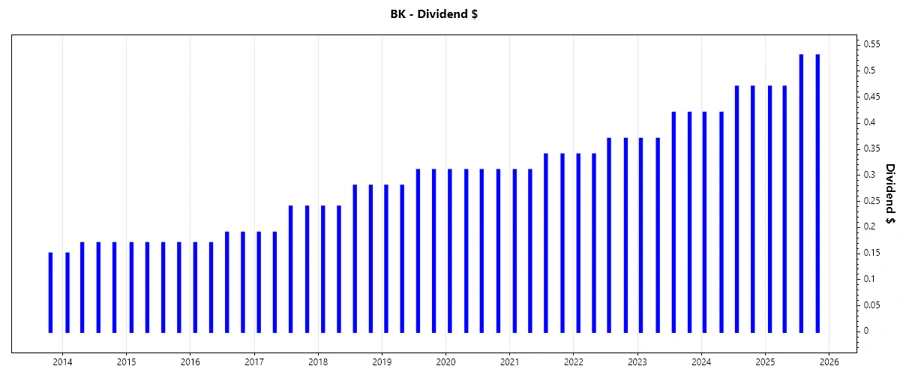
🗣️ Dividend History
BK’s history of dividends is pivotal, reflecting consistent shareholder value and financial soundness. Tracking dividends is crucial for understanding cash return trends.
| Year | Dividend per share (USD) |
|---|---|
| 2025 | 2.00 |
| 2024 | 1.78 |
| 2023 | 1.58 |
| 2022 | 1.42 |
| 2021 | 1.30 |
📈 Dividend Growth
Analyzing dividend growth allows investors to assess potential future payouts and firm commitment. An average growth of 8.57% over 5 years signifies moderate progress.
| Time | Growth |
|---|---|
| 3 years | 11.04 % |
| 5 years | 8.57 % |
The average dividend growth is 8.57% over 5 years. This shows moderate but steady dividend growth.
🔍 Payout Ratio
Payout ratios indicate sustainability of dividend distributions. BK’s EPS payout of 27.91% and FCF payout of 61.53% illustrate a conservative distribution strategy, ensuring obligations without overleveraging allowing room for growth.
| Key figure | Ratio |
|---|---|
| EPS-based | 27.91 % |
| Free cash flow-based | 61.53 % |
The relatively low EPS payout ratio suggests ample retained earnings for reinvestment or financial cushion.
💡 Cashflow & Capital Efficiency
Efficient cash flow management and capital utilization drive BK’s ability to maintain its dividend pledges. A comprehensive understanding of metrics like free cash flow yield and capex allows for evaluation of operational efficiency and investment returns.
| Year | 2024 | 2023 | 2022 |
|---|---|---|---|
| Free Cash Flow Yield | -1.37 % | 11.50 % | 37.17 % |
| Earnings Yield | 7.94 % | 8.09 % | 6.92 % |
| CAPEX to Operating Cash Flow | 2.14 | 0.21 | 0.09 |
| Stock-based Compensation to Revenue | 0% | 0% | 1.84% |
| Free Cash Flow / Operating Cash Flow Ratio | -113.83 | 79.36 | 91.07 |
The variance in free cash flow yield represents potential volatility but BK’s strategic capital management mitigates long-term risk.
📊 Balance Sheet & Leverage Analysis
A solid balance sheet underpins BK’s long-term solvency, bolstered by favorable leverage ratios and liquidity indicators. Addressing debt through efficient asset utilization is critical in safeguarding future dividends.
| Year | 2024 | 2023 | 2022 |
|---|---|---|---|
| Debt-to-Equity | 1.10 | 1.13 | 1.06 |
| Debt-to-Assets | 0.11 | 0.11 | 0.11 |
| Debt-to-Capital | 0.52 | 0.53 | 0.51 |
| Net Debt to EBITDA | 0 | −12.80 | −12.20 |
| Current Ratio | 0.65 | 0.78 | 0.74 |
| Quick Ratio | 0.65 | 0.78 | 0.74 |
| Financial Leverage | 10.07 | 10.05 | 9.96 |
The minimal rise in debt metrics indicates BK’s strategic debt management while maintaining liquid assets enhance agility in meeting financial obligations.
💰 Fundamental Strength & Profitability
Assessing profitability indicators such as ROE and margins provides insights into BK’s operational excellence and competitive positioning. Profitability persists as a cornerstone for funding divestments and capital allocation.
| Year | 2024 | 2023 | 2022 |
|---|---|---|---|
| Return on Equity | 10.96 % | 8.10 % | 6.27 % |
| Return on Assets | 1.09 % | 0.81 % | 0.63 % |
| Net Margin | 11.45 % | 9.77 % | 12.91 % |
| EBIT Margin | 14.79 % | 12.67 % | 17.58 % |
| EBITDA Margin | 19.34 % | 18.26 % | 26.56 % |
| Gross Margin | 45.98 % | 51.40 % | 81.55 % |
| Research & Development to Revenue | 0% | 0% | 0% |
Stable profitability ensures BK’s ability to sustain dividend payouts, even amidst shifting market conditions.
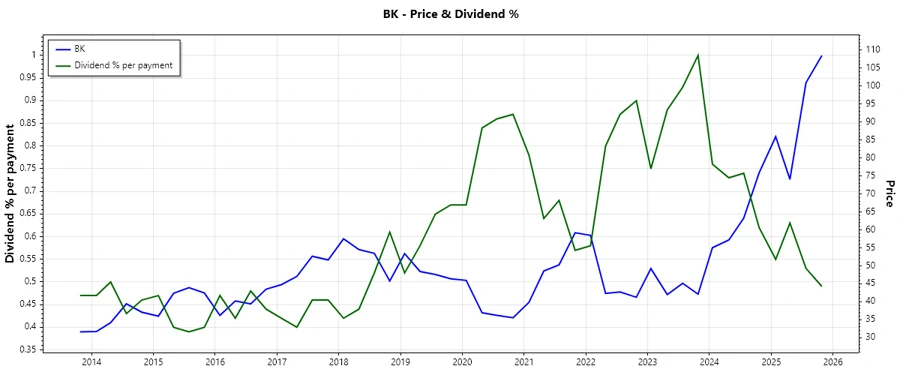
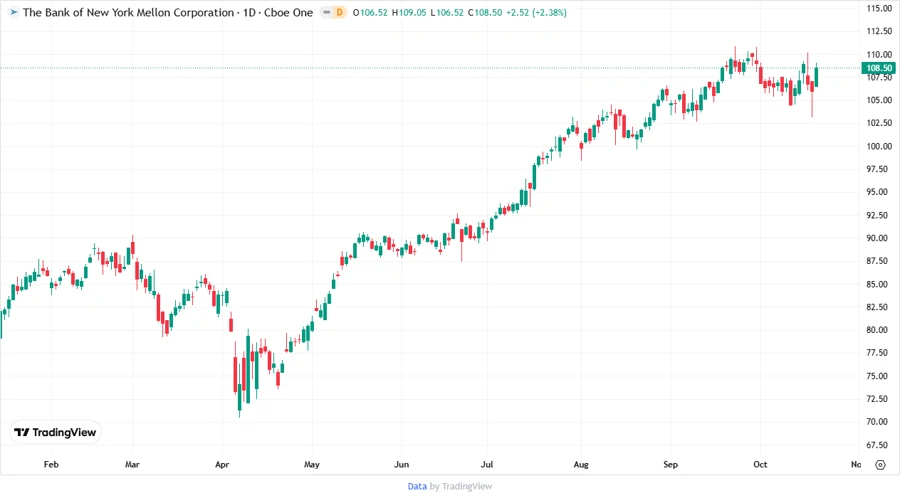
📈 Price Development
✅ Dividend Scoring System
| Category | Score (out of 5) | |
|---|---|---|
| Dividend yield | 3 | |
| Dividend Stability | 5 | |
| Dividend growth | 4 | |
| Payout ratio | 4 | |
| Financial stability | 5 | |
| Dividend continuity | 5 | |
| Cashflow Coverage | 3 | |
| Balance Sheet Quality | 4 |
Total Score: 33 out of 40
🔍 Rating
The Bank of New York Mellon Corporation offers a compelling dividend narrative for steady-income seekers. With robust financial health, consistent dividend growth, and prudent capital management, BK scores highly in stability and continuity. Investors seeking reliable and moderate returns would find BK a suitable addition to their portfolio.
Smart Data Insight
Master the Perfect Entry & Exit for this Stock
Don't leave your profits to chance. Historically, this stock follows specific seasonal patterns that institutional traders use to maximize returns.
- ✅ Identify the "Golden Buying Window"
- ✅ Avoid high-risk correction cycles
- ✅ Backtested data from the last 20+ years