
June 16, 2026 a 07:43 pm

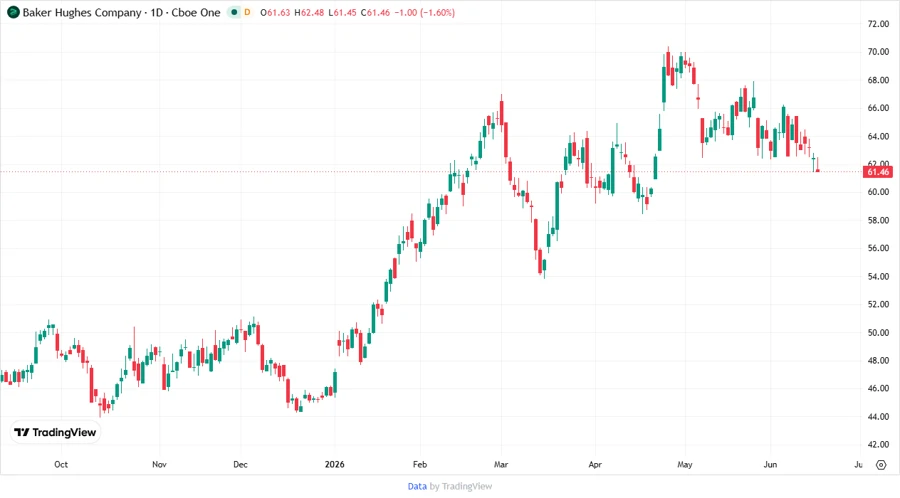
BKR: Fundamental Ratio Analysis - Baker Hughes Company
The Baker Hughes Company, a key player in the oil and gas equipment and services industry, demonstrates a robust position through its diversified technologies and services across its primary business segments. Its performance in exploration, production, and digital solutions makes it a strong candidate for investors considering the energy sector.
Fundamental Rating
Baker Hughes Company exhibits a solid fundamental base with balanced scores across various financial metrics which indicates a stable financial position.
| Category | Score | Visualization |
|---|---|---|
| Discounted Cash Flow | 3 | |
| Return On Equity | 4 | |
| Return On Assets | 4 | |
| Debt To Equity | 2 | |
| Price To Earnings | 2 | |
| Price To Book | 2 |
Historical Rating
Review of historical scores indicates consistent performance, highlighting areas of strength such as return metrics.
| Date | Overall | DCF | ROE | ROA | D/E | P/E | P/B |
|---|---|---|---|---|---|---|---|
| 6/16/2026 | 3 | 3 | 4 | 4 | 2 | 2 | 2 |
| Previous | 0 | 3 | 4 | 4 | 2 | 2 | 2 |
Analyst Price Targets
Analyst insights reflect optimism about Baker Hughes Company's price trajectory, with a strong consensus on future growth potential.
| High | Low | Median | Consensus |
|---|---|---|---|
| $80 | $60 | $74 | $73.2 |
Analyst Sentiment
The analyst sentiment indicates a generally positive outlook, with a predominant number of Buy ratings.
| Recommendation | Count | Percentage |
|---|---|---|
| Strong Buy | 0 | |
| Buy | 30 | |
| Hold | 14 | |
| Sell | 1 | |
| Strong Sell | 0 |
Conclusion
Baker Hughes Company stands as a stable entity in the energy sector, with actionable insights from analysts pointing towards positive growth. While it boasts strong returns on equity and assets, potential investors should balance optimism with the company's exposure to commodity price volatility and sectoral risks. Overall, mixed recommendations lean towards a favorable buy sentiment, capitalizing on its technological edge and diversified service portfolio.
Smart Data Insight
Master the Perfect Entry & Exit for this Stock
Don't leave your profits to chance. Historically, this stock follows specific seasonal patterns that institutional traders use to maximize returns.
- ✅ Identify the "Golden Buying Window"
- ✅ Avoid high-risk correction cycles
- ✅ Backtested data from the last 20+ years