
July 25, 2026 a 06:44 am
BKR: Fibonacci Analysis - Baker Hughes Company
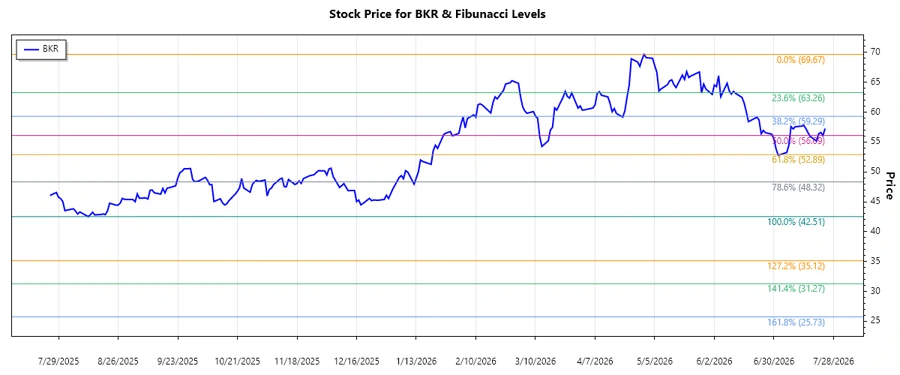
Baker Hughes Company's stock has experienced a significant downward trend over the past months. The company operates in the volatile oilfield services and equipment industry, which is highly sensitive to changes in oil prices and geopolitical events. Recent data reflects a decline in their stock price from its highs earlier in the year, facing potential resistance levels. Investors should be cautious as the volatility might offer both risks and opportunities in the near term.
Fibonacci Analysis
| Details | Value |
|---|---|
| Trend Period | 2025-07-28 to 2026-07-24 |
| High Point | $69.67 on 2026-04-30 |
| Low Point | $42.51 on 2025-08-12 |
| Fibonacci 0.236 | $56.11 |
| Fibonacci 0.382 | $51.81 |
| Fibonacci 0.5 | $47.59 |
| Fibonacci 0.618 | $45.02 |
| Fibonacci 0.786 | $42.89 |
The current stock price is $57.25, which is above the 0.236 retracement level. This suggests potential resistance near this area.
The analysis indicates that if the price holds above the 0.236 level, it might signify strength and potential reversal. However, if it falls below, a deeper retracement or continuation of the downtrend could occur.
Conclusion
The Baker Hughes Company stock is facing a challenging period as it resides within the crucial 0.236 Fibonacci retracement level. The price dynamics might witness significant movements based on market conditions and oil price fluctuations. Technical indicators suggest careful observation is necessary for potential reversals or further dips. For analysts, the current level serves as a critical point to watch for potential support and resistance. While there's room for a bullish reversal if the level holds, a failure may suggest further downside. Investors should stay informed of market changes and geopolitical factors that may influence oil prices. Analyzing current patterns and historical trends can provide insight into future price behavior.
Smart Data Insight
Master the Perfect Entry & Exit for this Stock
Don't leave your profits to chance. Historically, this stock follows specific seasonal patterns that institutional traders use to maximize returns.
- ✅ Identify the "Golden Buying Window"
- ✅ Avoid high-risk correction cycles
- ✅ Backtested data from the last 20+ years