August 10, 2025 a 03:15 pm

BKR: Fibonacci Analysis - Baker Hughes Company
Baker Hughes Company has shown significant resilience in its market position as a global leader in energy technologies and services. Recently, the stock exhibited a strong bullish trend, reflecting positive investor sentiment amid recovering oil prices. Given the company's diverse segment offerings in digital solutions, oilfield services, and turbomachinery, it is well-positioned to capture growth opportunities in the evolving energy landscape. However, potential volatility in energy markets and regulatory risks remain pertinent considerations for investors.
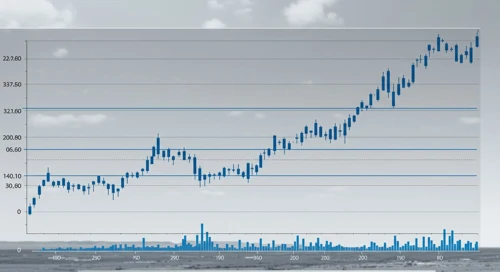
Fibonacci Analysis
The stock displayed a notable upward trend in recent months. Here are the detailed Fibonacci levels and analysis based on the trend:
| Detail | Information |
|---|---|
| Trend Start Date | 2024-09-12 |
| Trend End Date | 2025-07-28 |
| High Price (Date) | $46.55 (2025-07-28) |
| Low Price (Date) | $32.93 (2024-09-11) |
| Fibonacci Level 0.236 | $36.71 |
| Fibonacci Level 0.382 | $38.67 |
| Fibonacci Level 0.5 | $39.74 |
| Fibonacci Level 0.618 | $40.81 |
| Fibonacci Level 0.786 | $42.52 |
| Current Price | $43.29 (2025-08-08) |
| Current Retracement Zone | 0.786 |
| Technical Interpretation | The current price lies in the 0.786 Fibonacci retracement zone, indicating potential resistance. This level could either act as a barrier towards further growth or confirm underlying support if broken. |
Conclusion
The Baker Hughes Company has demonstrated a robust upward trend over the past months, indicating positive momentum. While the current price hovers around a notable Fibonacci level which might act as resistance, investors should monitor this level closely for potential breakouts. Continued growth in energy demand, coupled with Baker Hughes's innovative technologies portfolio, suggests bullish long-term prospects. However, external market volatility and regulatory challenges could pose risks. Analysts should remain vigilant for key resistance level breaches, which may signal a continuation of the upward trend.
Smart Data Insight
Master the Perfect Entry & Exit for this Stock
Don't leave your profits to chance. Historically, this stock follows specific seasonal patterns that institutional traders use to maximize returns.
- ✅ Identify the "Golden Buying Window"
- ✅ Avoid high-risk correction cycles
- ✅ Backtested data from the last 20+ years