June 22, 2025 a 03:15 pm

BKR: Fibonacci Analysis - Baker Hughes Company
Baker Hughes Company, operating within diverse segments of the energy and industrial sectors, has shown recent fluctuations in stock price which can be largely attributed to market dynamics and industry-specific trends. With their vast portfolio including oilfield services and digital solutions, they remain at the forefront of technological advancements in energy exploration and production. The near-term stock trend indicates a downward movement, offering opportunities to leverage Fibonacci Retracement for strategic investment decisions. This analysis reveals potential support and resistance levels that could be crucial for predicting future price movements.
Fibonacci Analysis
| Parameter | Details |
|---|---|
| Start Date | 2025-02-20 |
| End Date | 2025-06-20 |
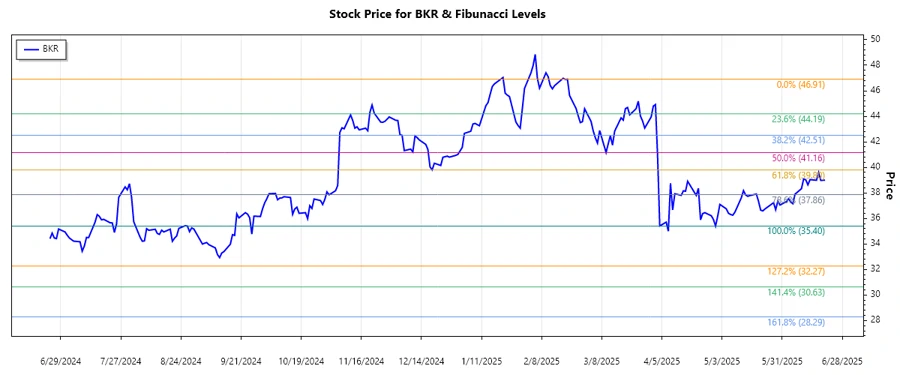
| High (Price & Date) | $46.91 on 2025-02-20 |
| Low (Price & Date) | $35.4 on 2025-04-30 |
| Fibonacci Level | Price Level |
|---|---|
| 0.236 | $38.85 |
| 0.382 | $40.36 |
| 0.5 | $41.15 |
| 0.618 | $41.95 |
| 0.786 | $43.13 |
The current stock price at $39 is within the 0.236 retracement level. This implies potential support here, making it a critical area where buying interest might emerge.
The Fibonacci Retracement levels suggest that if the price holds at the 0.236 level, we could expect a bounce. However, breaking below this might lead to further downward movement to test lower levels. Analysts should monitor these levels closely as indicators of market sentiment.
Conclusion
In capturing the stock's recent downtrend from February to June 2025, the Fibonacci Retracement analysis shows critical support and resistance areas. For investors, maintaining a keen eye on the 0.236 level could provide vital clues for potential rebounds or deeper corrections. This technical analysis underscores the importance of strategic entry and exit points, especially given Baker Hughes' exposure to fluctuating energy market demands. While potential rebound offers opportunities, risks remain for further declines prompting cautious positioning.
Smart Data Insight
Master the Perfect Entry & Exit for this Stock
Don't leave your profits to chance. Historically, this stock follows specific seasonal patterns that institutional traders use to maximize returns.
- ✅ Identify the "Golden Buying Window"
- ✅ Avoid high-risk correction cycles
- ✅ Backtested data from the last 20+ years