March 13, 2026 a 02:46 am


BKR: Dividend Analysis - Baker Hughes Company
Baker Hughes Company, a prominent player in the oilfield services sector, delivers a blend of consistent dividend payments and moderate growth prospects. Their solid track record of paying dividends for 40 years demonstrates resilience, though the relatively low dividend yield of 1.54% suggests a stable but conservative income aspect for investors. The company's strong financial metrics, including appropriate payout ratios and growth trends, provide a firm foundation for investors seeking moderate income alongside potential capital appreciation.
Overview 📊
In examining Baker Hughes' dividend profile, it's notable that the company operates within the industrials sector, known for its stable cash flows, which underpin its capacity to maintain a steady dividend stream. With a dividend yield of 1.54%, Baker Hughes offers a moderate return on investment relative to its industry peers. The company has a strong dividend history, boasting 40 years of uninterrupted payments, illustrating its commitment to shareholder returns.
| Sector | Dividend Yield | Current Dividend per Share | Dividend History | Last Cut or Suspension |
|---|---|---|---|---|
| Industrials | 1.54% | 0.92 USD | 40 years | None |
Dividend History 🗣️
Analyzing Baker Hughes' dividend history reveals a consistent payout trend, providing assurance to income-focused investors. The absence of recent dividend cuts or suspensions further enhances its reputation as a reliable dividend payer. Such consistency attracts investors seeking dependable income streams, emphasizing the stability sought in dividend investing.
| Year | Dividend per Share (USD) |
|---|---|
| 2026 | 0.23 |
| 2025 | 0.92 |
| 2024 | 0.84 |
| 2023 | 0.78 |
| 2022 | 0.73 |
Dividend Growth 📈
Baker Hughes showcases moderate dividend growth, registering an 8% increase over the past three years and 5% over five years. This growth is pivotal for long-term investors, as it indicates a company's ability to increase returns in line with inflation, thus preserving purchasing power.
| Time | Growth |
|---|---|
| 3 years | 8.02% |
| 5 years | 5.02% |
The average dividend growth is 5.02% over 5 years. This shows moderate but steady dividend growth, highlighting Baker Hughes' potential for yielding increased future income.
Payout Ratio ✅
Assessing payout ratios, Baker Hughes maintains an EPS-based payout ratio at 35.16% and a free cash flow-based ratio at 35.86%. These figures suggest that the company retains sufficient earnings for reinvestment while rewarding shareholders. A payout ratio below 50% typically indicates a sustainable dividend policy and room for future growth.
| Key Figure | Ratio |
|---|---|
| EPS-based | 35.16% |
| Free cash flow-based | 35.86% |
Both EPS and free cash flow payout ratios are comfortably below typical red-flag thresholds, suggesting Baker Hughes has a balanced approach to distributing profits.
Cashflow & Capital Efficiency 💰
Cashflow analysis shows a free cash flow yield of 4.59% and an earnings yield of 4.69%, implying a decent return relative to market capitalization. CAPEX to operating cash flow at approximately 33% indicates effective capital reinvestment, aligning with the company's growth strategies without excessive capital drain.
| Metric | 2025 | 2024 | 2023 |
|---|---|---|---|
| Free Cash Flow Yield | 5.64% | 5.00% | 5.33% |
| Earnings Yield | 5.75% | 7.26% | 5.64% |
| CAPEX/Operating Cash Flow | 33.38% | 38.35% | 39.97% |
| Stock Compensation/Revenue | 0.73% | 0.72% | 0.77% |
| Free Cash Flow/Operating Cash Flow | 66.59% | 61.64% | 60.02% |
Baker Hughes demonstrates healthy cashflow sustainability and efficient capital utilization, enhancing its capability to fund dividends and future growth initiatives.
Balance Sheet & Leverage Analysis 🏢
Baker Hughes maintains conservative leverage ratios, with debt-to-equity at 0.38 and net debt to EBITDA at 0.8, indicating a controlled debt level relative to earnings. The current and quick ratios provide assurance of liquidity adequacy.
| Metric | 2025 | 2024 | 2023 |
|---|---|---|---|
| Debt-to-Equity | 0.38 | 0.36 | 0.39 |
| Debt-to-Assets | 0.17 | 0.16 | 0.16 |
| Debt-to-Capital | 0.28 | 0.26 | 0.28 |
| Net Debt to EBITDA | 0.80 | 0.58 | 0.85 |
| Current Ratio | 1.36 | 1.32 | 1.25 |
| Quick Ratio | 1.00 | 0.94 | 0.86 |
The balance sheet underscores Baker Hughes' robust financial footing, signifying sound liquidity management backed by prudent leverage practices.
Fundamental Strength & Profitability 💪
The company's profitability metrics such as return on equity (ROE) and return on assets (ROA) at 14.43% and 6.33% respectively, highlight efficient asset utilization and robust shareholder value enhancement, complemented by maintained margins across income levels.
| Metric | 2025 | 2024 | 2023 |
|---|---|---|---|
| Return on Equity | 13.74% | 17.63% | 12.64% |
| Return on Assets | 6.33% | 7.77% | 5.26% |
| Net Margin | 9.33% | 10.70% | 7.62% |
| EBIT Margin | 11.17% | 12.44% | 11.26% |
| EBITDA Margin | 15.46% | 16.53% | 15.51% |
| Gross Margin | 23.60% | 20.99% | 20.59% |
| R&D/Revenue | 2.16% | 2.31% | 0.77% |
Baker Hughes' operational efficiency and profitability are intact, driven by strategic investments leading to sustained returns and growth.
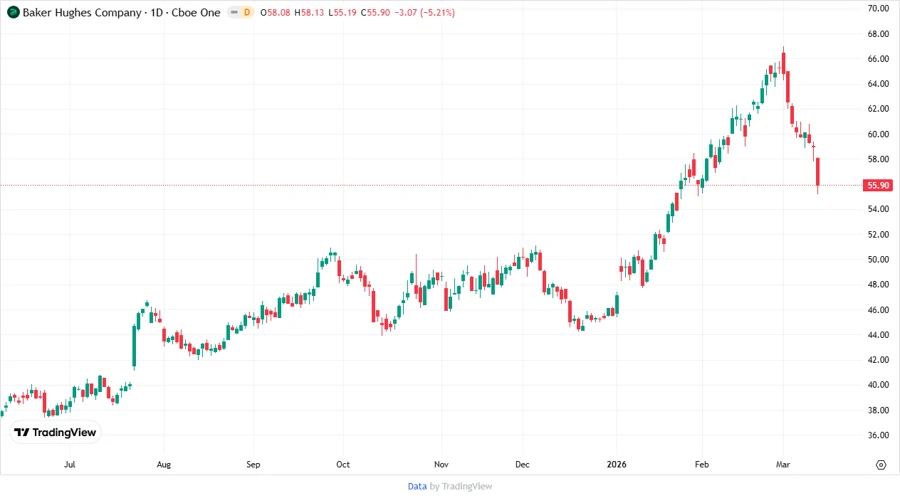
Price Development 🌟
Dividend Scoring System 🔍
| Category | Score | Score Bar |
|---|---|---|
| Dividend Yield | 3 / 5 | |
| Dividend Stability | 5 / 5 | |
| Dividend Growth | 3 / 5 | |
| Payout Ratio | 4 / 5 | |
| Financial Stability | 5 / 5 | |
| Dividend Continuity | 5 / 5 | |
| Cashflow Coverage | 4 / 5 | |
| Balance Sheet Quality | 4 / 5 |
Total Score: 33 / 40
Rating 🏆
On balancing Baker Hughes' dividend propositions with its solid financial health, the recommendation leans towards a "Moderate Buy". It's suitable for investors seeking steady, reliable income with some scope for future growth. The company’s stable dividend and responsible financial management strategies make it an appealing option in volatile market conditions.