February 20, 2026 a 03:31 pm

BKR: Dividend Analysis - Baker Hughes Company
Baker Hughes Company demonstrates a commitment to shareholder returns through stable dividends and a strong market presence. With a history spanning 40 years of consistent dividends and a solid financial base, the company appears well-positioned to offer resilient dividend payouts. However, investors should be mindful of relatively modest yield and moderate growth, suggesting a focus on dividend sustainability over aggressive increases.
📊 Overview
The following presents crucial details regarding Baker Hughes' dividend profile, significant in shaping investor decisions.
| Criteria | Values |
|---|---|
| Sector | Oilfield Services/Equipment |
| Dividend yield | 1.54 % |
| Current dividend per share | 0.92 USD |
| Dividend history | 40 years |
| Last cut or suspension | None |
🗣️ Dividend History
Baker Hughes Company's dividend history underscores its commitment to stable, long-term shareholder returns. Sustaining dividends for four decades, the company reflects durability and predictability, key concerns for dividend-seeking investors.
| Year | Dividend per share (USD) |
|---|---|
| 2026 | 0.23 |
| 2025 | 0.92 |
| 2024 | 0.84 |
| 2023 | 0.78 |
| 2022 | 0.73 |
📈 Dividend Growth
The dividend growth analysis provides insights into the company's commitment to enhancing shareholder value via increased dividends. Growth rates are essential indicators of a company's willingness and ability to enhance payouts over time.
| Time | Growth |
|---|---|
| 3 years | 8.02 % |
| 5 years | 5.02 % |
The average dividend growth is 5.02% over 5 years. This shows moderate but steady dividend growth, indicating a stable financial policy for enhancing shareholder returns.
⚠️ Payout Ratio
Payout ratios indicate the proportion of earnings and free cash flow returned to shareholders as dividends. These ratios shed light on sustainability and possible future policy changes.
| Key figure | Ratio |
|---|---|
| EPS-based | 35.16 % |
| Free cash flow-based | 35.86 % |
The EPS-based payout is 35.16%, while the FCF-based ratio is 35.86%. These figures suggest manageable dividend obligations, promising for maintaining or potentially increasing future dividends.
📊 Cashflow & Capital Efficiency
Analyzing cash flow stability and capital efficiency is essential for understanding a company's ability to sustain operations and growth. Capital efficiency ratios provide insights into how well the company is utilizing its resources to generate profit.
| Year | Free Cash Flow Yield | Earnings Yield | CAPEX to Operating Cash Flow | Stock-based Compensation to Revenue | Free Cash Flow / Operating Cash Flow Ratio |
|---|---|---|---|---|---|
| 2025 | 5.64% | 5.75% | 33.41% | 0.73% | 66.59% |
| 2024 | 5.01% | 7.26% | 38.35% | 0.73% | 61.64% |
| 2023 | 5.33% | 5.63% | 39.97% | 0.77% | 60.03% |
Cash flow and capital efficiency data reveal Baker Hughes maintains healthy cash generation relative to expenses. This capability enhances the company’s resilience in varied economic environments.
🗓️ Balance Sheet & Leverage Analysis
A robust balance sheet underscores the company's fiscal strength, aiding in dividend sustainability and financial stability, especially under economic stresses.
| Year | Debt-to-Equity | Debt-to-Assets | Debt-to-Capital | Net Debt to EBITDA | Current Ratio | Quick Ratio |
|---|---|---|---|---|---|---|
| 2025 | 37.93% | 17.48% | 27.50% | 0.80 | 1.36 | 1.00 |
| 2024 | 35.65% | 15.70% | 26.28% | 0.58 | 1.32 | 0.94 |
| 2023 | 39.18% | 16.30% | 28.15% | 0.85 | 1.25 | 0.86 |
Examination of leverage reveals that Baker Hughes maintains a conservative debt strategy, supporting long-term financial durability and capacity for dividend continuity.
👨💼 Fundamental Strength & Profitability
Profitability metrics provide insight into overall health and operational efficiency, important elements for dividend security and potential growth.
| Year | Return on Equity | Return on Assets | Net Margin | EBIT Margin | EBITDA Margin | Gross Margin | Research & Development to Revenue |
|---|---|---|---|---|---|---|---|
| 2025 | 13.74% | 6.33% | 9.33% | 11.17% | 15.46% | 23.60% | 2.16% |
| 2024 | 17.63% | 7.77% | 10.70% | 12.44% | 16.53% | 20.99% | 2.31% |
| 2023 | 12.64% | 5.26% | 7.62% | 11.26% | 15.52% | 20.59% | 0% |
Profitability remains strong, enhanced by continuous focus on efficiency and innovation, reinforcing the foundation for future dividend security and potential growth.
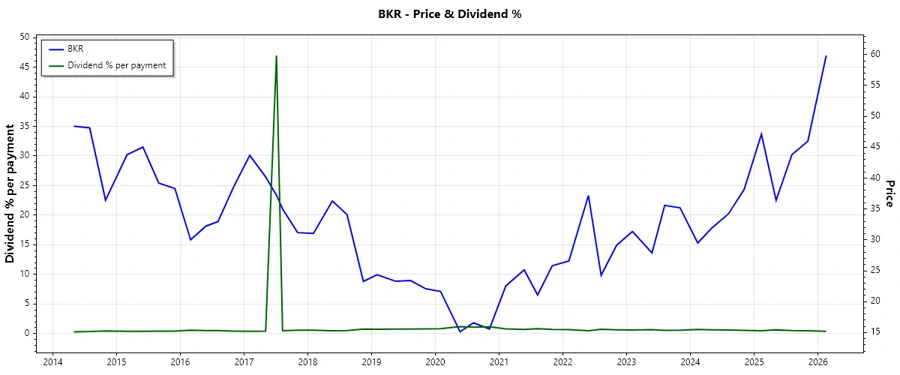
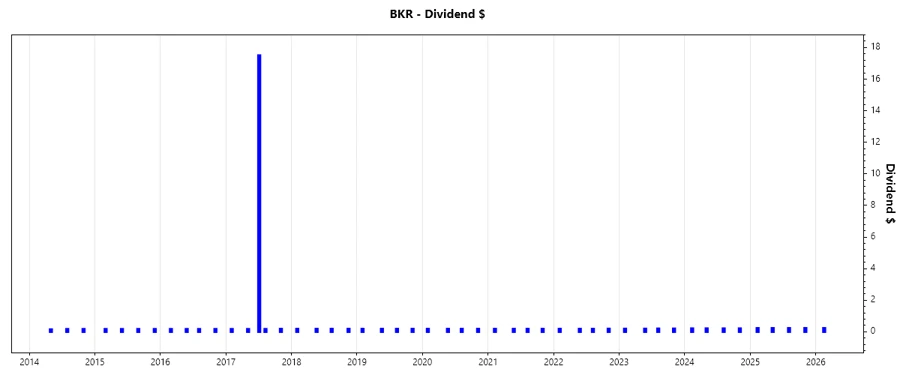
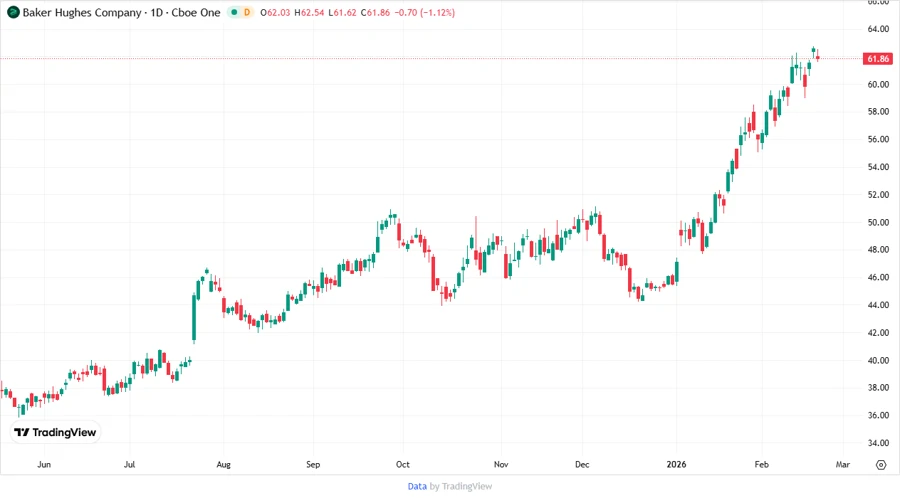
📉 Price Development
✅ Dividend Scoring System
| Category | Details | Score |
|---|---|---|
| Dividend yield | Moderate yield consistent with sector standards. | 3/5 |
| Dividend Stability | 4 decades of uninterrupted payouts. | 5/5 |
| Dividend growth | Steady growth, suggests company commitment. | 4/5 |
| Payout ratio | Conservatively managed, prioritizing sustainability. | 4/5 |
| Financial stability | Leverage is managed, showcasing robustness. | 4/5 |
| Dividend continuity | No recent cuts or suspensions, ensuring confidence. | 4/5 |
| Cashflow Coverage | Healthy cash flow supports dividends. | 4/5 |
| Balance Sheet Quality | Sound, supporting financial strategies. | 4/5 |
Total Score: 32/40
📟 Rating
Baker Hughes Company's dividend profile suggests a strong, reliable option for conservative investors seeking stable distributions with modest growth potential. The company exemplifies robust management and strategic financial planning, meriting a favorable rating. Investors prioritizing dividend growth might seek alternatives, yet for stability and continuity, Baker Hughes stands out.
Smart Data Insight
Master the Perfect Entry & Exit for this Stock
Don't leave your profits to chance. Historically, this stock follows specific seasonal patterns that institutional traders use to maximize returns.
- ✅ Identify the "Golden Buying Window"
- ✅ Avoid high-risk correction cycles
- ✅ Backtested data from the last 20+ years