October 27, 2025 a 07:46 am
BKR: Dividend Analysis - Baker Hughes Company
Baker Hughes Company exhibits a resilient dividend profile with a steady history of payouts. Its conservative dividend yield of approximately 1.95% and a history of over 39 years indicate its commitment to returning value to its shareholders. Despite experiencing a cut in 2018, the company has shown progress in maintaining stable dividend payments, aligning with shareholder expectations in a volatile market. As a key player in the Energy Sector, it provides an attractive option for long-term income-focused investors.
Overview 📊
Baker Hughes operates within the Energy Sector, characterized by a disciplined approach to dividend management. The company offers a dividend yield of 1.95% and pays a current dividend of 0.836 USD per share. It boasts a 39-year dividend history, indicating a robust track record. However, it experienced its last cut in 2018, highlighting a need for continuous monitoring of its dividend stability.
| Metric | Value |
|---|---|
| Sector | Energy |
| Dividend yield | 1.95% |
| Current dividend per share | 0.84 USD |
| Dividend history | 39 years |
| Last cut or suspension | 2018 |
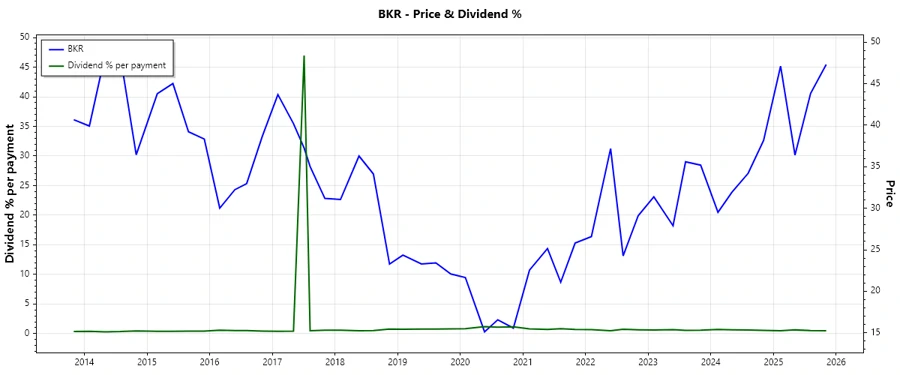
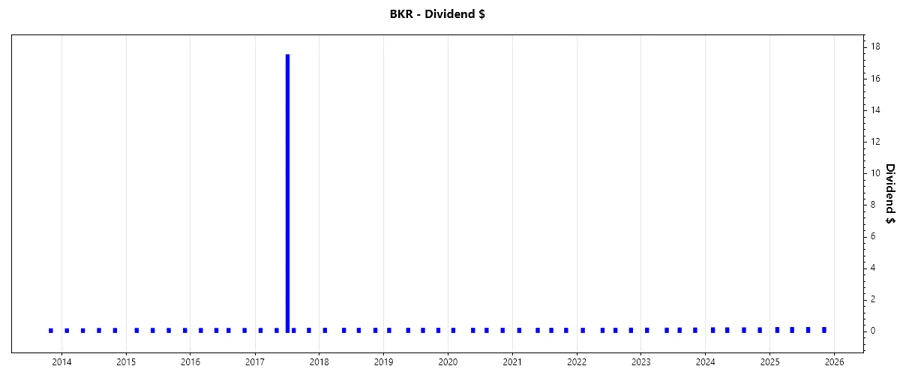
Dividend History 📉
A 39-year history of dividend payments reflects Baker Hughes' stability and consistency in rewarding its shareholders. This longevity is significant as it establishes confidence among investors regarding the company's financial health and operational stability.
| Year | Dividend per Share (USD) |
|---|---|
| 2025 | 0.92 |
| 2024 | 0.84 |
| 2023 | 0.78 |
| 2022 | 0.73 |
| 2021 | 0.72 |
Dividend Growth 📈
Dividend growth is a critical indicator of a company’s progressive financial strategy. Over the past 3 and 5 years, Baker Hughes has exhibited growth, indicating its efforts to enhance shareholder value and its potential for future expansion.
| Time | Growth |
|---|---|
| 3 years | 5.27% |
| 5 years | 3.13% |
The average dividend growth is 3.13% over 5 years. This shows moderate but steady dividend growth, reinforcing investor faith in its future potential.
Payout Ratio 🗣️
Analyzing payout ratios helps determine the sustainability of dividend payments. Baker Hughes has an EPS-based payout ratio of 28.52% and an FCF-based payout ratio of 30.65%, reflecting a conservative approach to dividend distribution. These ratios imply that the company judiciously maintains adequate capital for business growth while distributing income to shareholders.
| Key figure | Ratio |
|---|---|
| EPS-based | 28.52% |
| Free cash flow-based | 30.65% |
The EPS and FCF payout ratios are both under 35%, suggesting that the dividends are likely to be sustainable under the current economic environment, allowing for potential reinvestment and debt coverage.
Cashflow & Capital Efficiency ⚠️
Evaluating cash flow is essential to assess a company’s capability to sustain operations and dividends. Baker Hughes showcases healthy free cash flow and earnings yields, coupled with a manageable CAPEX and stock-based compensation structure.
| Attribute | 2023 | 2022 |
|---|---|---|
| Free Cash Flow Yield | 5.33% | 3.82% |
| Earnings Yield | 5.64% | -2.06% |
| CAPEX to Operating Cash Flow | 39.97% | 40.89% |
| Stock-based Compensation to Revenue | 0.77% | 0.97% |
| Free Cash Flow / Operating Cash Flow Ratio | 60.03% | 59.11% |
The company's cash flow and capital efficiency ratios support its dividend payments and indicate robust operational health, fostering investor confidence in terms of return on invested capital.
Balance Sheet & Leverage Analysis ✅
Baker Hughes maintains a balanced capital structure with moderate leverage ratios, suggesting strategic debt management and favorable liquidity conditions.
| Attribute | 2023 | 2022 |
|---|---|---|
| Debt-to-Equity | 39.18% | 46.26% |
| Debt-to-Assets | 16.30% | 19.48% |
| Debt-to-Capital | 28.15% | 31.63% |
| Net Debt to EBITDA | 0.85 | 3.12 |
| Current Ratio | 1.25 | 1.32 |
| Quick Ratio | 0.86 | 0.90 |
| Financial Leverage | 2.40 | 2.37 |
Baker Hughes' balance sheet indicates strong financial health, supported by sound liquidity metrics and reasonable leverage, ensuring operational and dividend payment stability.
Fundamental Strength & Profitability ⚠️
Examining a company's fundamental strength reveals its capability to generate profits in a sustainable manner. Baker Hughes displays strong returns and margin metrics.
| Attribute | 2023 | 2022 |
|---|---|---|
| Return on Equity | 12.64% | -4.18% |
| Return on Assets | 5.26% | -1.76% |
| Net Margin | 7.62% | -2.84% |
| EBIT Margin | 11.26% | 1.29% |
| EBITDA Margin | 15.52% | 6.31% |
| Gross Margin | 20.59% | 20.80% |
| R&D to Revenue | 2.31% | 0% |
The firm’s return metrics suggest considerable profitability potential, despite some volatility, enhancing its long-term appeal to investors.
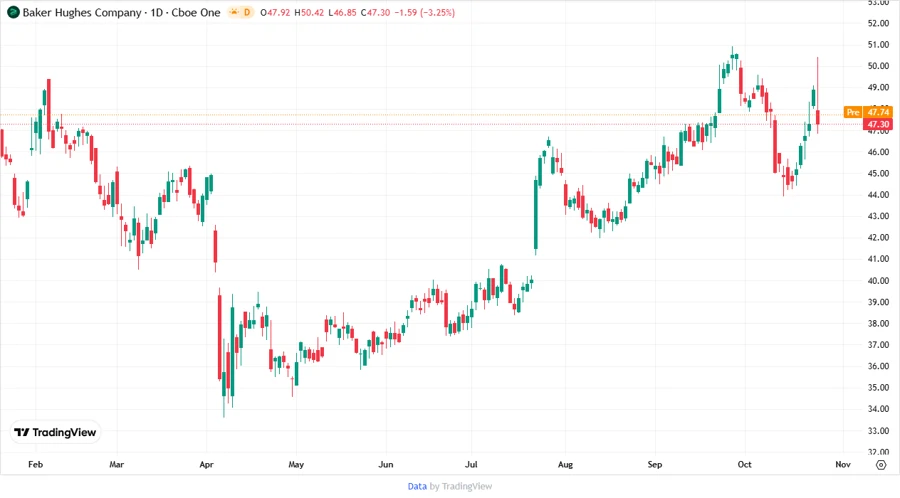
Price Development 📈
Dividend Scoring System 🗣️
| Criteria | Score | Indicator |
|---|---|---|
| Dividend yield | 3 | |
| Dividend Stability | 4 | |
| Dividend Growth | 3 | |
| Payout ratio | 5 | |
| Financial stability | 4 | |
| Dividend continuity | 4 | |
| Cashflow Coverage | 4 | |
| Balance Sheet Quality | 4 |
Total Score: 31/40
Rating ✅
Overall, Baker Hughes is a reliable investment for those seeking dividend stability and moderate growth. Despite its volatility, it maintains good financial health and remains committed to rewarding its investors. With a total score of 31 out of 40, it holds a strong position within the energy sector, making it a prudent choice for dividend-focused investors.