July 26, 2025 a 03:31 am


BKR: Dividend Analysis - Baker Hughes Company
Baker Hughes Company exhibits a stable dividend history, with a current dividend yield of approximately 1.95%. Although the company has a firm foothold in the market, its dividend growth over recent years has been modest, indicating a focus on maintaining stable payouts rather than aggressive growth.
📊 Overview
The comprehensive examination of Baker Hughes reveals its operational stature in the energy sector, boasting a robust dividend history that spans 39 years. Despite a modest yield of 1.95%, the stability of payouts testifies to its commitment to shareholder returns. No recent dividend cut or suspension suggests a steady cash flow management strategy.
| Sector | Dividend Yield | Current Dividend per Share | Dividend History | Last Cut or Suspension |
|---|---|---|---|---|
| Energy | 1.95% | $0.84 | 39 years | None |
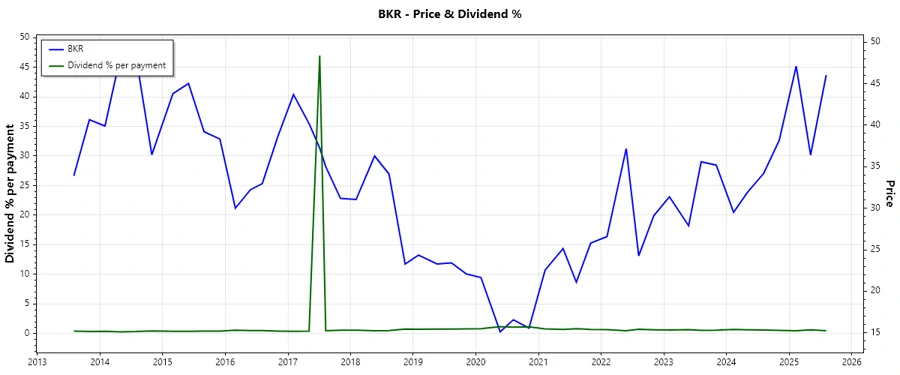
🗣️ Dividend History
Baker Hughes' dividend payment consistency highlights a prudent financial management approach. With dividends paid over the past decades, stakeholders have seen reliable returns. Monitoring this consistency is vital for evaluating long-term financial health.
| Year | Dividend per Share |
|---|---|
| 2025 | $0.69 |
| 2024 | $0.84 |
| 2023 | $0.78 |
| 2022 | $0.73 |
| 2021 | $0.72 |
📈 Dividend Growth
The dividend growth analysis reveals gradual increments, averaging 3.13% over the past 5 years. This moderate growth reflects a cautious but dependable approach to dividend increases, aligning with corporate stability over expansion.
| Time | Growth |
|---|---|
| 3 years | 5.27% |
| 5 years | 3.13% |
The average dividend growth is 3.13% over 5 years. This shows moderate but steady dividend growth.
⚠️ Payout Ratio
Understanding payout ratios aids in evaluating dividend sustainability. An EPS-based payout ratio of 27.11% and FCF-based payout ratio of 33.60% suggest a conservative approach, ensuring dividend security without straining financial resources.
| Key Figure | Ratio |
|---|---|
| EPS-based | 27.11% |
| Free cash flow-based | 33.60% |
The EPS payout indicates a sustainable effort in maintaining dividends with room for future increases as financial performance improves.
✅ Cashflow & Capital Efficiency
Analyzing cashflow and capital efficiency metrics over time reveals Baker Hughes' ability to generate and sustain free cashflow. Despite fluctuations, the CAPEX to Operating Cash Flow ratios remain stable, reflecting efficiency in capital deployment.
| Year | Free Cash Flow Yield | Earnings Yield | CAPEX to Operating Cash Flow | Stock-based Compensation to Revenue | Free Cash Flow / Operating Cash Flow Ratio |
|---|---|---|---|---|---|
| 2024 | 5.00% | 7.26% | 38.36% | 0.73% | 61.64% |
| 2023 | 5.33% | 5.64% | 39.97% | 0.77% | 60.03% |
| 2022 | 3.83% | -2.06% | 40.89% | 0.98% | 59.11% |
The metrics showcase a solid cash efficiency rate, indicating prudent capital management conducive for sustaining shareholder distributions.
📉 Balance Sheet & Leverage Analysis
Debt-to-equity and net debt to EBITDA ratios offer insight into leverage and financial strategy. Baker Hughes maintains conservative leverage, limiting financial risk exposure while ensuring liquidity with a consistent quick ratio.
| Year | Debt-to-Equity | Debt-to-Assets | Debt-to-Capital | Net Debt to EBITDA | Current Ratio | Quick Ratio | Financial Leverage |
|---|---|---|---|---|---|---|---|
| 2024 | 35.65% | 15.70% | 26.28% | 0.63 | 0 | 94.35% | 2.27 |
| 2023 | 39.18% | 16.30% | 28.15% | 0.85 | 0 | 86.27% | 2.40 |
| 2022 | 46.25% | 19.48% | 31.62% | 3.12 | 0 | 90.34% | 2.37 |
The balance sheet reflects strong financial health, underscoring successful leverage strategies and operational liquidity to support long-term dividends.
💪 Fundamental Strength & Profitability
Profitability metrics like ROE, ROA, and various margin analyses demonstrate efficient operations. Baker Hughes capitalizes on its assets and capital to generate competitive returns, supporting ongoing dividend payments.
| Year | Return on Equity | Return on Assets | Net Margin | EBIT Margin | EBITDA Margin | Gross Margin | R&D to Revenue |
|---|---|---|---|---|---|---|---|
| 2024 | 17.63% | 7.77% | 10.70% | 12.44% | 16.53% | 20.99% | 2.31% |
| 2023 | 12.64% | 5.26% | 7.62% | 11.26% | 15.52% | 20.58% | 0% |
| 2022 | -4.18% | -1.76% | -2.84% | 1.29% | 6.31% | 20.80% | 0% |
These metrics highlight Baker Hughes' capability to efficiently utilize its resources, reinforcing its position to uphold and potentially enhance its dividend yield.
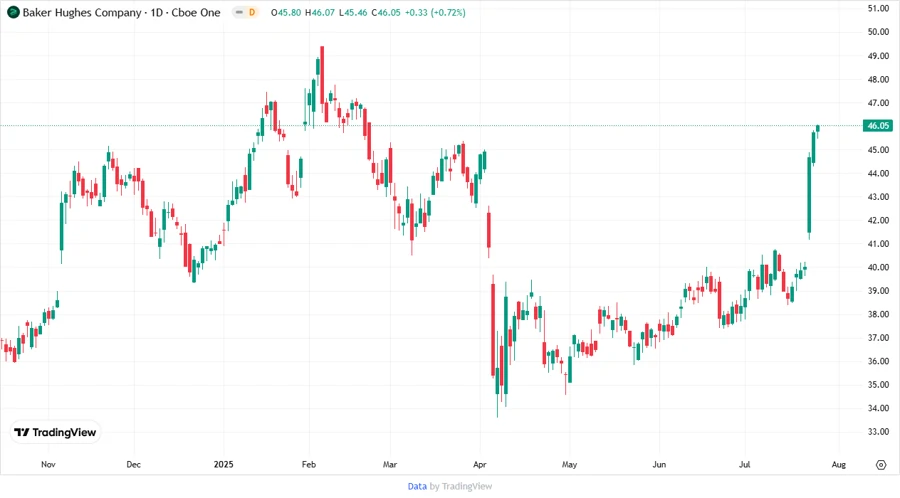
📊 Price Development
🏅 Dividend Scoring System
| Criteria | Score (1-5) | Score Bar |
|---|---|---|
| Dividend yield | 3 | |
| Dividend Stability | 5 | |
| Dividend growth | 3 | |
| Payout ratio | 4 | |
| Financial stability | 4 | |
| Dividend continuity | 5 | |
| Cashflow Coverage | 4 | |
| Balance Sheet Quality | 4 |
Total Score: 32/40
🔍 Rating
Overall, Baker Hughes Company presents itself as a steady dividend-paying entity with strong financial health and operational efficiency. While its dividend growth is conservative, the stability and continuity offer a degree of assurance to investors seeking moderate yet reliable returns. This supports a rating of "Buy" for investors prioritizing stable income streams without substantial short-term growth expectations.
Smart Data Insight
Master the Perfect Entry & Exit for this Stock
Don't leave your profits to chance. Historically, this stock follows specific seasonal patterns that institutional traders use to maximize returns.
- ✅ Identify the "Golden Buying Window"
- ✅ Avoid high-risk correction cycles
- ✅ Backtested data from the last 20+ years