
July 24, 2026 a 03:15 pm
BIIB: Fibonacci Analysis - Biogen Inc.
The Biogen Inc. stock has recently demonstrated a distinct upward trend reflecting positive investor sentiment. Considering Biogen's robust biotech portfolio and strategic partnerships, the stock is well-positioned in the market. However, investors should remain vigilant of the inherent volatility within the biotech industry.
Fibonacci Analysis
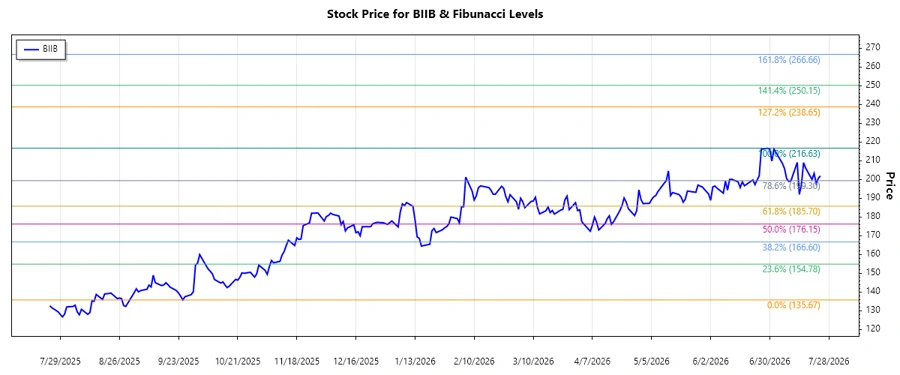
Analyzing Biogen Inc.'s stock data over the past months, a clear upward trend can be identified, commencing at its low on September 26, 2025, with a price of $135.67 and reaching a high on July 14, 2026, at $216.63. Based on this trend, Fibonacci Retracement levels are calculated to assess potential support and resistance scenarios:
| Trend Details | Value |
|---|---|
| Start Date | 2025-09-26 |
| End Date | 2026-07-14 |
| High (Price/Date) | $216.63 / 2026-07-14 |
| Low (Price/Date) | $135.67 / 2025-09-26 |
| Fibonacci Level | Price Level |
|---|---|
| 0.236 | $194.83 |
| 0.382 | $181.90 |
| 0.5 | $176.15 |
| 0.618 | $170.40 |
| 0.786 | $155.45 |
Currently, the price of $201.82 suggests that the stock is retracing from its recent highs. It is above all key Fibonacci retracement levels, indicating ongoing bullish momentum. This may offer a strong support zone around $194.83 if the stock corrects downwards, highlighting potential trading opportunities.
Conclusion
Biogen Inc.'s stock exhibits a prominent upward trajectory, enhancing its appeal through strategic ventures and product offerings. Growth potential is augmented by its focus on novel therapies for neurodegenerative diseases, while market volatility remains a tangible risk. The stock's current position above key Fibonacci levels underscores investor confidence but warrants caution amidst innate biotech sector risks. This analysis serves as a guide for potential investment decisions and portfolio diversification strategies.
Smart Data Insight
Master the Perfect Entry & Exit for this Stock
Don't leave your profits to chance. Historically, this stock follows specific seasonal patterns that institutional traders use to maximize returns.
- ✅ Identify the "Golden Buying Window"
- ✅ Avoid high-risk correction cycles
- ✅ Backtested data from the last 20+ years