December 01, 2025 a 04:44 pm

BIIB: Fibonacci Analysis - Biogen Inc.
Biogen Inc. has shown a notable upward trend in recent months, driven by advancements in their neurological therapies and strategic collaborations. The stock has witnessed significant price movements, capturing the interest of investors. While Biogen faces competition and regulatory challenges, their research pipeline offers potential long-term growth.
Fibonacci Analysis
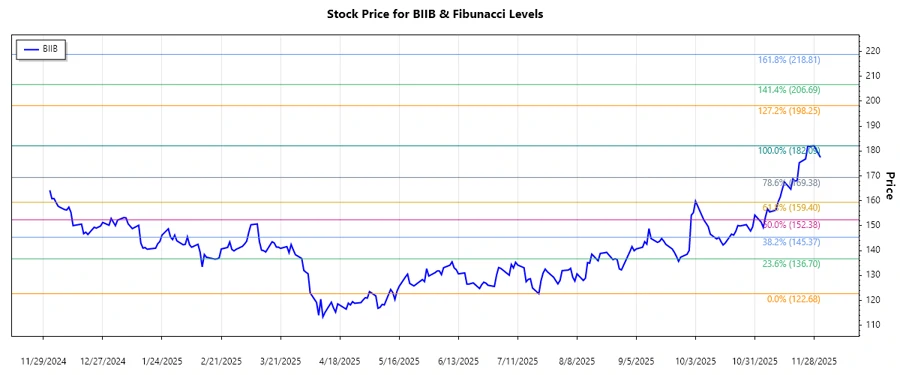
The data reflects a dominant upward trend for Biogen Inc. from July to December 2025. Using the data to calculate Fibonacci retracement levels, we provide the following insights:
| Aspect | Details |
|---|---|
| Trend Start Date | 2025-07-21 |
| Trend End Date | 2025-12-01 |
| High Point (Price/Date) | $182.09 on 2025-11-28 |
| Low Point (Price/Date) | $122.68 on 2025-07-21 |
Fibonacci Levels
| Level | Price |
|---|---|
| 0.236 | $164.58 |
| 0.382 | $157.38 |
| 0.5 | $152.39 |
| 0.618 | $147.39 |
| 0.786 | $140.44 |
The current stock price, as of December 1, 2025, at $177.448, is above all major retracement levels and indicates that the stock remains strong with potential support being established above these Fibonacci thresholds. Current analysis suggests continued upward momentum with the potential for brief retracements to the 0.236 level ($164.58) observed.
Conclusion
Biogen Inc. has exhibited a robust bullish trend, supported by strategic product developments and promising collaborations, yet challenges remain regarding market competition and regulatory landscapes. Investors should monitor key support levels identified through Fibonacci analysis, particularly around the 0.236 retracement level, which could serve as a viable entry point if the stock experiences short-term corrections. Overall, the company’s advancements position it well for future growth, contingent upon successful product rollouts and market acceptance.