July 29, 2025 a 11:44 am

BIIB: Fibonacci Analysis - Biogen Inc.
Biogen Inc., a leader in neurological treatments, has been experiencing significant market movements. With a strong product portfolio targeting multiple sclerosis and Alzheimer's disease, the stock shows promising volatility. However, it faces risks related to research outcomes and market competition.
Fibonacci Analysis
| Trend Detail | Information |
|---|---|
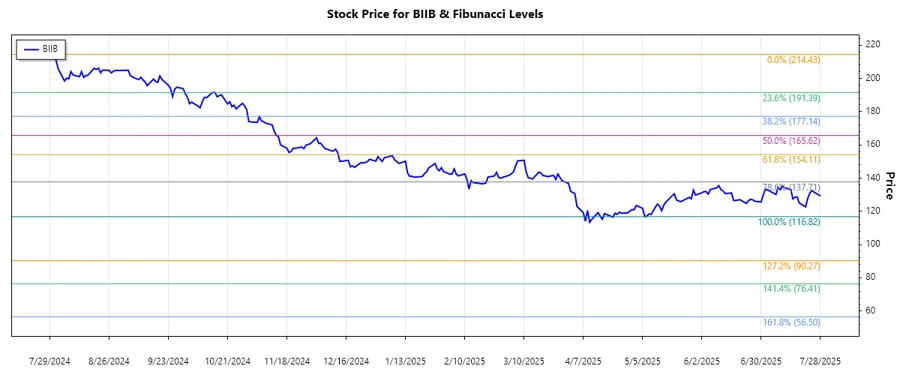
| Start Date | 2024-07-29 |
| End Date | 2025-05-09 |
| High Price | $214.43 on 2024-07-29 |
| Low Price | $116.82 on 2025-05-06 |
| Fibonacci Level | Price |
|---|---|
| 0.236 | $140.61 |
| 0.382 | $153.94 |
| 0.5 | $165.63 |
| 0.618 | $177.33 |
| 0.786 | $193.67 |
The current price of $129.28 is below the 0.236 retracement level, indicating a continuing downward trend. This suggests potential further declines unless it breaks above this level, which could indicate a strengthening market sentiment.
Conclusion
Biogen Inc. has encountered a significant downturn from its previous highs due to adverse market effects and competition. As it currently trades below critical Fibonacci levels, further declines are possible unless strong support is identified. Moving forward, attention will be on research breakthroughs or regulatory approvals, which could catalyze a reversal. Investors should be cautious due to prevailing volatility but may find opportunities in long-term recovery driven by its pipeline potential.
Smart Data Insight
Master the Perfect Entry & Exit for this Stock
Don't leave your profits to chance. Historically, this stock follows specific seasonal patterns that institutional traders use to maximize returns.
- ✅ Identify the "Golden Buying Window"
- ✅ Avoid high-risk correction cycles
- ✅ Backtested data from the last 20+ years