June 20, 2025 a 05:15 am
BIIB: Fibonacci Analysis - Biogen Inc.
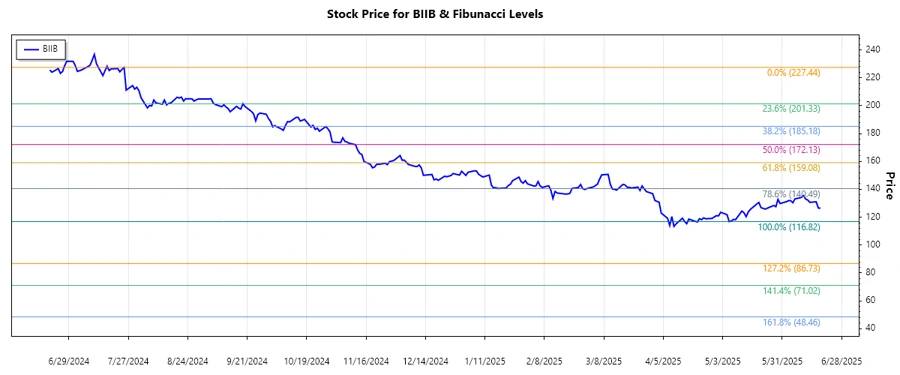
Biogen Inc. has been demonstrating a persistent downtrend over the last few months, reflected in its stock price movements. Driven by market conditions and company-specific factors, the price has been on a steady decline, despite its robust portfolio in neurological therapies. A Fibonacci analysis reveals potential key levels that may influence future price actions.
Fibonacci Analysis
| Start Date | End Date | High Price (Date) | Low Price (Date) | Fibonacci Levels | Current Price | Retracement Zone | Interpretation |
|---|---|---|---|---|---|---|---|
| 2024-07-25 | 2025-06-18 | 227.44 (2024-07-25) | 116.82 (2025-05-06) |
|
126.54 | 0.236 | The current price is in the 0.236 retracement zone, indicating potential resistance around this level. Traders may look for potential support if prices struggle to break higher. |
Conclusion
Biogen Inc.'s stock is seen within a downtrend, with the current market condition keeping it near the lower Fibonacci retracement levels. While its diverse drug portfolio supports long-term growth, short-term market sentiment dominates. Traders will closely watch how the price interacts with Fibonacci levels, particularly the 0.236 and 0.382, to gauge potential reversals or continued declines. While resistance appears strong, any breakthrough above these levels could signal strengthening bullish momentum. Analysts suggest keeping an eye on upcoming product launches and quarterly earnings for potential market-moving announcements.
Smart Data Insight
Master the Perfect Entry & Exit for this Stock
Don't leave your profits to chance. Historically, this stock follows specific seasonal patterns that institutional traders use to maximize returns.
- ✅ Identify the "Golden Buying Window"
- ✅ Avoid high-risk correction cycles
- ✅ Backtested data from the last 20+ years