August 16, 2025 a 11:45 am
BG: Fibonacci Analysis - Bunge Global S.A.
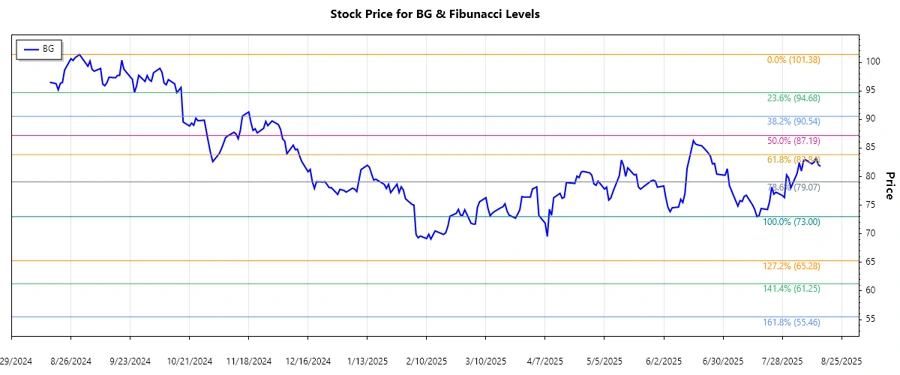
Bunge Global S.A. has shown a notable trend in its stock price movement over recent months. After reaching a significant high in the period, the stock began a downtrend with some oscillations at various levels. Given its diverse operations in agribusiness and energy, the market movements reflect investor sentiment about commodity prices and bioenergy prospects. A precise Fibonacci analysis will aid in understanding potential support and resistance levels.
Fibonacci Analysis
| Detail | Value |
|---|---|
| Analyzed Trend Start Date | 2024-08-30 |
| Analyzed Trend End Date | 2025-08-15 |
| High Point (Price & Date) | $101.38 on 2024-08-30 |
| Low Point (Price & Date) | $73.00 on 2025-07-16 |
| Fibonacci 0.236 Level | $79.58 |
| Fibonacci 0.382 Level | $83.41 |
| Fibonacci 0.5 Level | $87.19 |
| Fibonacci 0.618 Level | $90.97 |
| Fibonacci 0.786 Level | $96.07 |
| Current Retracement Zone | 0.5 |
| Technical Interpretation | The current price is within the 0.5 Fibonacci level zone, indicating potential support. This could suggest consolidation before a potential reversal or continuation. |
Conclusion
In conclusion, Bunge Global S.A. is currently navigating a critical retracement zone that could signify a pivotal point in its stock price trajectory. The existing price support around the 0.5 Fibonacci level might offer grounding for an upward movement if economic conditions and market sentiment align favorably. Caution should be exercised, however, as breaking below this support could lead to further declines back to previous lows. Analysts will be closely monitoring Bunge's performance in the commodity and energy sectors, as well as global market dynamics, which could significantly impact the stock’s momentum. The intricate dynamics within Bunge's diverse operations could either enhance its resilience or present additional volatility risks in the short to medium term.
Smart Data Insight
Master the Perfect Entry & Exit for this Stock
Don't leave your profits to chance. Historically, this stock follows specific seasonal patterns that institutional traders use to maximize returns.
- ✅ Identify the "Golden Buying Window"
- ✅ Avoid high-risk correction cycles
- ✅ Backtested data from the last 20+ years