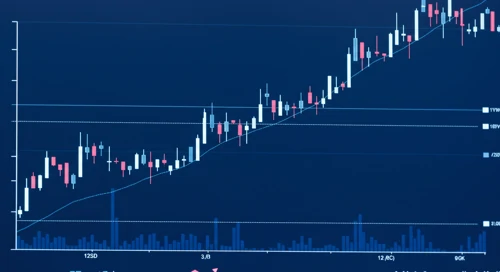
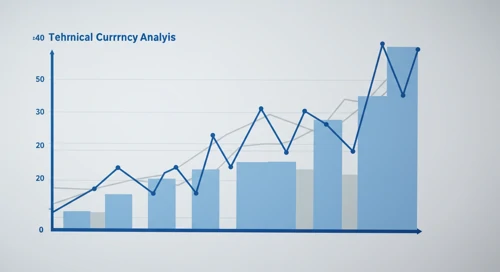
ATO: Fibunacci Level Technical Analysis - Atmos Energy Corporation
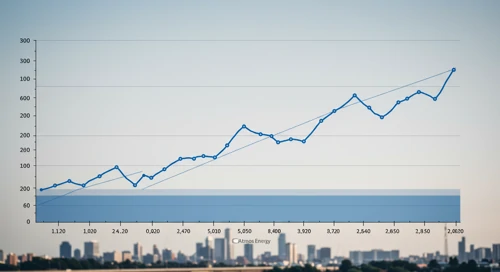
ATO: Fibonacci retracement levels to identify key potential support and resistance zones, based on recent price trends.
May 26, 2026 a 04:44 pm
BRO: Analysts Ratings - Brown and Brown Inc
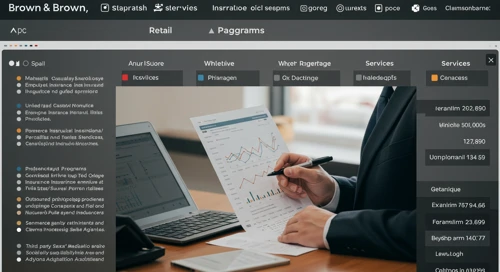
BRO: Comprehensive breakdown of current and historical analyst ratings, offering insights into how expert sentiment has evolved over time.
May 26, 2026 a 04:38 pm
FICO: Fundamental Ratio Analysis - Fair Isaac Corporation
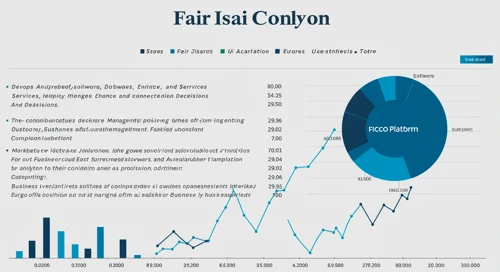
FICO: Evaluation of key financial ratios, analyst ratings, and price targets. A data-driven perspective on the valuation and market expectations.
May 26, 2026 a 03:43 pm
Utilities Comparison. 26 May

Comparison of Utilities. Where is strength and weakness? What has developed well and badly?
May 26, 2026 a 03:16 pm
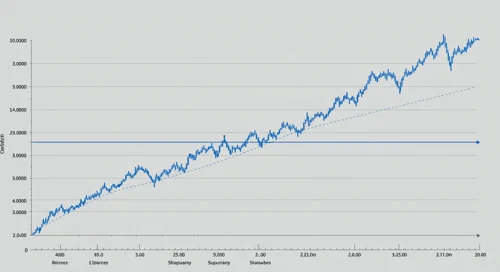
ARES: Fibunacci Level Technical Analysis - Ares Management Corporation
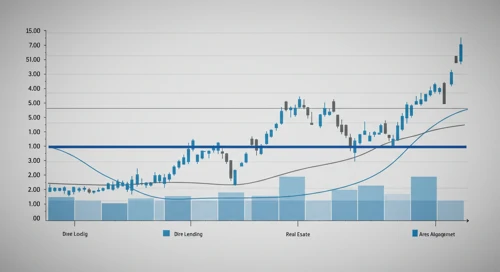
ARES: Fibonacci retracement levels to identify key potential support and resistance zones, based on recent price trends.
May 26, 2026 a 03:15 pm
TRMB: Trend with Support and Resistance Levels - Trimble Inc
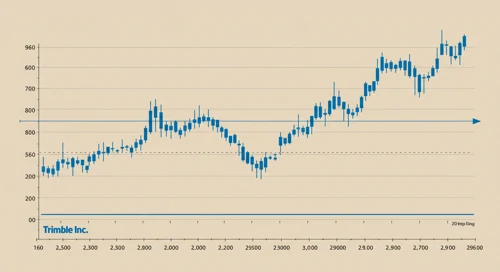
TRMB: Current price trend is evaluated alongside key support and resistance level. View of potential turning points and price momentum.
May 26, 2026 a 02:03 pm
TDG: Trend with Support and Resistance Levels - TransDigm Group Incorporated
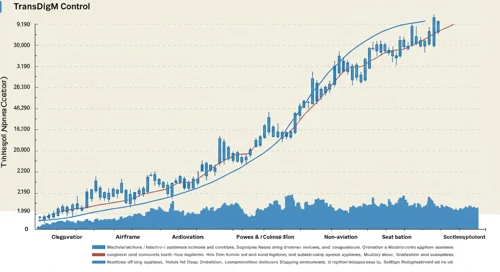
TDG: Current price trend is evaluated alongside key support and resistance level. View of potential turning points and price momentum.
May 26, 2026 a 01:15 pm
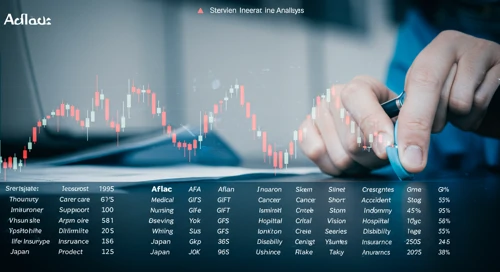
AFL: Fundamental Ratio Analysis - Aflac Incorporated
May 26, 2026 a 07:43 pm

Todays Important Key Figures 26 May
May 26, 2026 a 07:00 pm
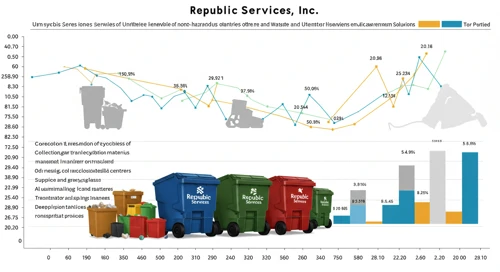
RSG: Fundamental Ratio Analysis - Republic Services Inc
May 26, 2026 a 06:00 pm

MSFT: Analysts Ratings - Microsoft Corporation
May 26, 2026 a 05:00 pm
NWS: Fundamental Ratio Analysis - News Corporation
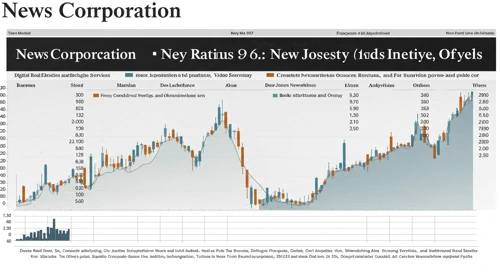
NWS: Evaluation of key financial ratios, analyst ratings, and price targets. A data-driven perspective on the valuation and market expectations.
May 26, 2026 a 01:00 pm
LNT: Analysts Ratings - Alliant Energy Corporation

LNT: Comprehensive breakdown of current and historical analyst ratings, offering insights into how expert sentiment has evolved over time.
May 26, 2026 a 01:00 pm
MA: Dividend Analysis - Mastercard Incorporated

MA: In-depth analysis of a company's dividend stability and key fundamental ratios to assess its financial strength and long-term investment potential.
May 26, 2026 a 12:46 pm
RCL: Analysts Ratings - Royal Caribbean Cruises Ltd

RCL: Comprehensive breakdown of current and historical analyst ratings, offering insights into how expert sentiment has evolved over time.
May 26, 2026 a 12:38 pm
Commodities Comparison. 26 May

Comparison of Commodities. Where is strength and weakness? What has developed well and badly?
May 26, 2026 a 12:31 pm
ALB: Fibunacci Level Technical Analysis - Albemarle Corporation
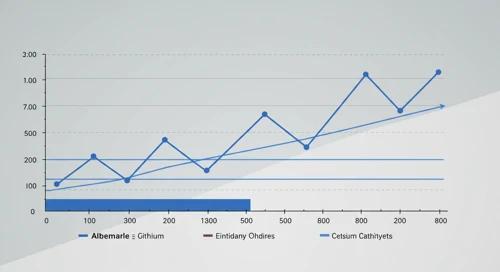
ALB: Fibonacci retracement levels to identify key potential support and resistance zones, based on recent price trends.
May 26, 2026 a 11:44 am
INTC: Fundamental Ratio Analysis - Intel Corporation
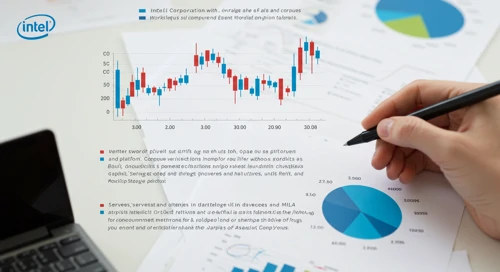
INTC: Evaluation of key financial ratios, analyst ratings, and price targets. A data-driven perspective on the valuation and market expectations.
May 26, 2026 a 11:43 am
Stock Market - Heatmap
Use mouse wheel to zoom in and out. Click a ticker to display detailed information in a new window. Hover mouse cursor over a ticker to see more data.
Stock's
HUBB: Analysts Ratings - Hubbell Incorporated
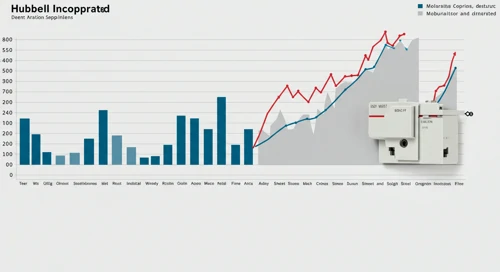
HUBB: Comprehensive breakdown of current and historical analyst ratings, offering insights into how expert sentiment has evolved over time.
May 26, 2026 a 08:38 am
TGT: Trend with Support and Resistance Levels - Target Corporation
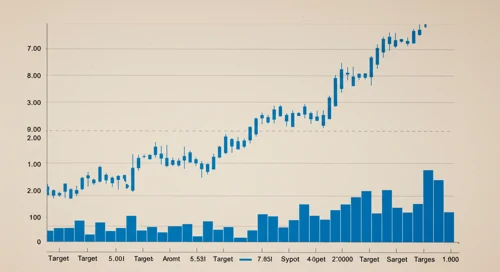
TGT: Current price trend is evaluated alongside key support and resistance level. View of potential turning points and price momentum.
May 26, 2026 a 08:15 am
QCOM: Fundamental Ratio Analysis - QUALCOMM Incorporated
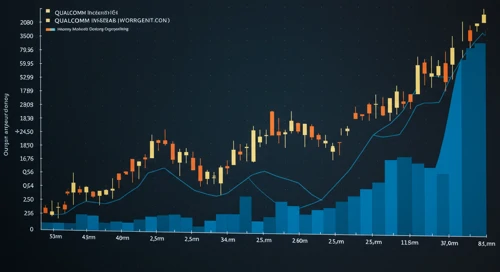
QCOM: Evaluation of key financial ratios, analyst ratings, and price targets. A data-driven perspective on the valuation and market expectations.
May 26, 2026 a 08:00 am
CSCO: Dividend Analysis - Cisco Systems Inc
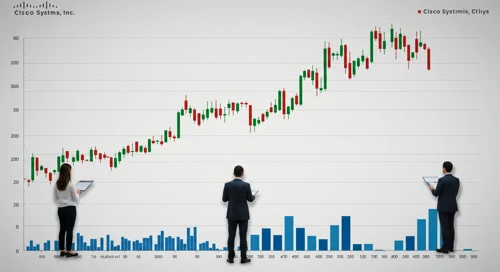
CSCO: In-depth analysis of a company's dividend stability and key fundamental ratios to assess its financial strength and long-term investment potential.
May 26, 2026 a 07:46 am
PSA: Fundamental Ratio Analysis - Public Storage
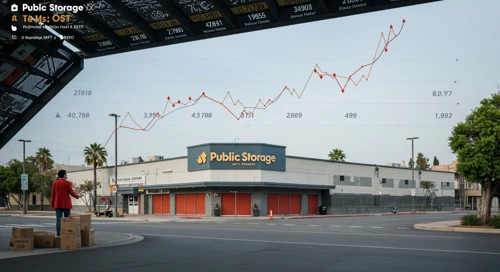
PSA: Evaluation of key financial ratios, analyst ratings, and price targets. A data-driven perspective on the valuation and market expectations.
May 26, 2026 a 07:43 am
EFX: Dividend Analysis - Equifax Inc

EFX: In-depth analysis of a company's dividend stability and key fundamental ratios to assess its financial strength and long-term investment potential.
May 26, 2026 a 07:31 am
EA: Fibunacci Level Technical Analysis - Electronic Arts Inc
EA: Fibonacci retracement levels to identify key potential support and resistance zones, based on recent price trends.
May 26, 2026 a 06:44 am
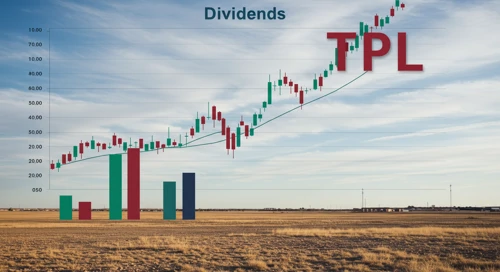
TPL: Dividend Analysis - Texas Pacific Land Corporation
May 26, 2026 a 11:31 am
IRM: Fibunacci Level Technical Analysis - Iron Mountain Incorporated
May 26, 2026 a 10:15 am
MO: Trend with Support and Resistance Levels - Altria Group Inc
May 26, 2026 a 09:03 am

MDLZ: Analysts Ratings - Mondelez International Inc
May 26, 2026 a 09:00 am
WAT: Fibunacci Level Technical Analysis - Waters Corporation
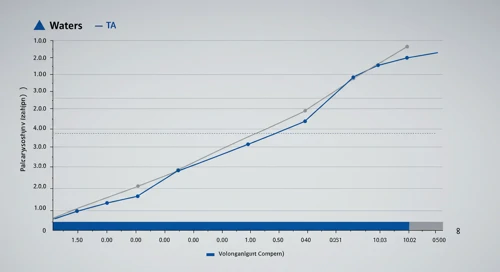
WAT: Fibonacci retracement levels to identify key potential support and resistance zones, based on recent price trends.
May 26, 2026 a 05:15 am
SYF: Trend with Support and Resistance Levels - Synchrony Financial
SYF: Current price trend is evaluated alongside key support and resistance level. View of potential turning points and price momentum.
May 26, 2026 a 03:15 am
TECH: Dividend Analysis - Bio Techne Corporation
TECH: In-depth analysis of a company's dividend stability and key fundamental ratios to assess its financial strength and long-term investment potential.
May 26, 2026 a 02:46 am
FICO: Analysts Ratings - Fair Isaac Corporation

FICO: Comprehensive breakdown of current and historical analyst ratings, offering insights into how expert sentiment has evolved over time.
May 25, 2026 a 09:00 pm
AIG: Analysts Ratings - American International Group Inc

AIG: Comprehensive breakdown of current and historical analyst ratings, offering insights into how expert sentiment has evolved over time.
May 25, 2026 a 08:38 pm
IVZ: Fundamental Ratio Analysis - Invesco Ltd
IVZ: Evaluation of key financial ratios, analyst ratings, and price targets. A data-driven perspective on the valuation and market expectations.
May 25, 2026 a 07:43 pm
STT: Fundamental Ratio Analysis - State Street Corporation
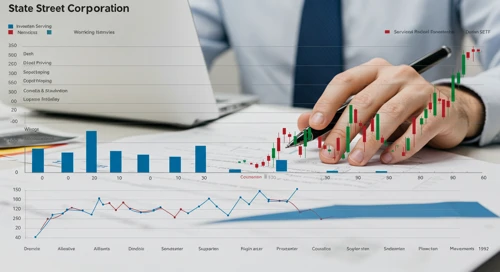
STT: Evaluation of key financial ratios, analyst ratings, and price targets. A data-driven perspective on the valuation and market expectations.
May 25, 2026 a 06:00 pm
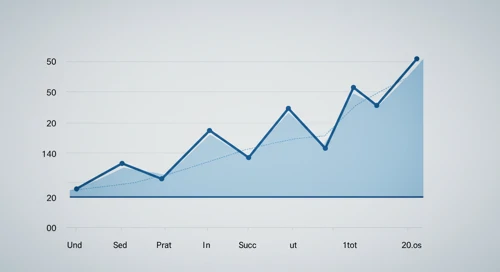
Economic Calendar
Currencies
GBPUSD: Fibunacci Level Technical Analysis
GBPUSD: Fibonacci retracement levels to identify key potential support and resistance zones, based on recent price trends.
May 25, 2026 a 05:08 am
GBPJPY: Trend with Support and Resistance Levels
GBPJPY: Current price trend is evaluated alongside key support and resistance level. View of potential turning points and price momentum.
May 25, 2026 a 04:28 am
GBPCAD: Fibunacci Level Technical Analysis
GBPCAD: Fibonacci retracement levels to identify key potential support and resistance zones, based on recent price trends.
May 24, 2026 a 05:08 am
NZDCAD: Trend with Support and Resistance Levels
NZDCAD: Current price trend is evaluated alongside key support and resistance level. View of potential turning points and price momentum.
May 24, 2026 a 04:28 am
AUDNZD: Fibunacci Level Technical Analysis
AUDNZD: Fibonacci retracement levels to identify key potential support and resistance zones, based on recent price trends.
May 23, 2026 a 05:08 am
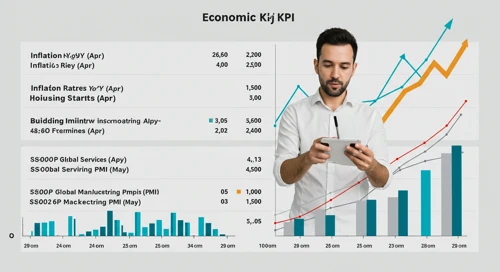
Todays Important Key Figures 23 May

Today’s important economic data releases – a snapshot of key indicators influencing markets and shaping financial expectations.
May 22, 2026 a 11:00 pm
Todays Important Key Figures 22 May

Today’s important economic data releases – a snapshot of key indicators influencing markets and shaping financial expectations.
May 22, 2026 a 07:00 pm
CADJPY: Fibunacci Level Technical Analysis
May 26, 2026 a 05:08 am
EURGBP: Trend with Support and Resistance Levels
May 26, 2026 a 04:28 am

Important Key Figures of the last Days
May 26, 2026 a 02:31 am

Todays Important Key Figures 25 May
May 25, 2026 a 07:00 pm
USDJPY: Fibunacci Level Technical Analysis
USDJPY: Fibonacci retracement levels to identify key potential support and resistance zones, based on recent price trends.
May 22, 2026 a 05:08 am
AUDCAD: Trend with Support and Resistance Levels
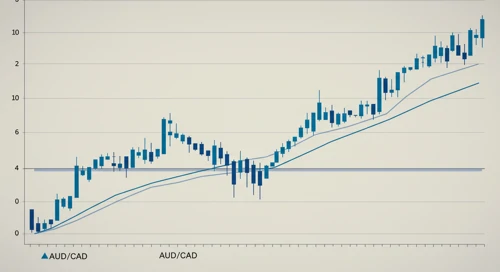
AUDCAD: Current price trend is evaluated alongside key support and resistance level. View of potential turning points and price momentum.
May 22, 2026 a 04:28 am
Todays Important Key Figures 21 May
Today’s important economic data releases – a snapshot of key indicators influencing markets and shaping financial expectations.
May 21, 2026 a 07:00 pm
EURAUD: Fibunacci Level Technical Analysis
EURAUD: Fibonacci retracement levels to identify key potential support and resistance zones, based on recent price trends.
May 21, 2026 a 05:08 am
AUDJPY: Trend with Support and Resistance Levels
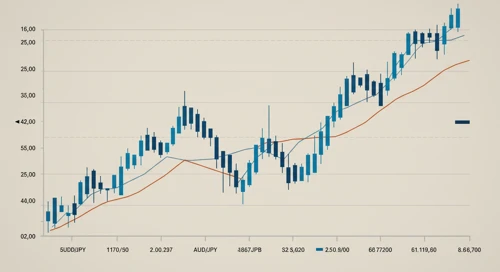
AUDJPY: Current price trend is evaluated alongside key support and resistance level. View of potential turning points and price momentum.
May 21, 2026 a 04:28 am
Important Key Figures of the last Days

Overview of key economic indicators released over the past days, highlighting their potential impact on markets and investor sentiment.
May 21, 2026 a 02:31 am
Todays Important Key Figures 20 May

Today’s important economic data releases – a snapshot of key indicators influencing markets and shaping financial expectations.
May 20, 2026 a 07:00 pm
Currencies