February 07, 2026 a 03:31 pm


BG: Dividend Analysis - Bunge Global S.A.
Bunge Global S.A., with a robust history of 26 years of stable dividends, presents an intriguing profile for dividend investors. While the dividend yield of 2.42% may not exceed market giants, the steady growth and resilience in challenging economic climates highlight Bunge's commitment to shareholders. The absence of recent dividend cuts underlines a strong financial footing, inviting further scrutiny into its payout health and long-term sustainability.
📊 Overview
| Metric | Value |
|---|---|
| Sector | Agribusiness |
| Dividend yield | 2.42% |
| Current dividend per share | 2.77 USD |
| Dividend history | 26 years |
| Last cut or suspension | None |
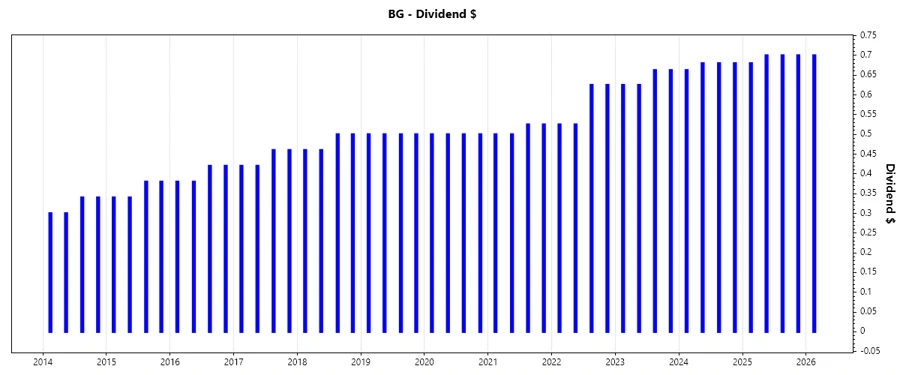
🗣️ Dividend History
The reliability of Bunge's dividend history is a testament to its stable profitability and management's focus on returning capital to shareholders. Examining the history can reveal consistency and growth patterns crucial for predicting future payouts.
| Year | Dividend per Share (USD) |
|---|---|
| 2026 | 0.70 |
| 2025 | 2.78 |
| 2024 | 2.70 |
| 2023 | 2.58 |
| 2022 | 2.30 |
📈 Dividend Growth
Bunge's dividend growth is an indicator of its capacity to enhance shareholder value through increasing payouts. Sustained growth rates can signify financial health and operational efficiency.
| Time | Growth |
|---|---|
| 3 years | 6.52% |
| 5 years | 6.81% |
The average dividend growth is 6.81% over 5 years. This shows moderate but steady dividend growth.
🧮 Payout Ratio
Bunge's payout ratios provide insights into its dividend coverage and sustainability. High payout ratios may indicate a risk to dividend continuity if earnings fluctuate.
| Key figure ratio | |
|---|---|
| EPS-based | 66.08% |
| Free cash flow-based | 180.63% |
The EPS-based payout ratio of 66.08% suggests a manageable dividend policy, while the high FCF-based payout indicates potential stress on cash flows should free cash flow not stabilize.
💹 Cashflow & Capital Efficiency
Evaluating Bunge's cash flow metrics alongside capital efficiency offers insights into fiscal stability and returns on investments. Consistent cash flow and effective capital deployment underpin strong dividend reliability.
| Year | 2025 | 2024 | 2023 |
|---|---|---|---|
| Free Cash Flow Yield | -6.24% | 4.83% | 14.55% |
| Earnings Yield | 5.52% | 10.47% | 14.93% |
| CAPEX to Operating Cash Flow | 215.38% | 72.42% | 33.92% |
| Stock-based Compensation to Revenue | 0.08% | 0.12% | 0.12% |
| Free Cash Flow / Operating Cash Flow Ratio | -115.38% | 27.58% | 66.08% |
The cash flow metrics reflect variability with recent improvements, suggesting enhancing cash efficiency and prudent capital usage.
⚖️ Balance Sheet & Leverage Analysis
Bunge's balance sheet analysis, including leverage ratios, illustrates its capacity to manage obligations and maintain financial health. Controlled leverage and liquidity ensure operational resilience and strategic flexibility.
| Year | 2025 | 2024 | 2023 |
|---|---|---|---|
| Debt-to-Equity | 0.98 | 0.72 | 0.53 |
| Debt-to-Assets | 0.38 | 0.29 | 0.23 |
| Debt-to-Capital | 0.49 | 0.42 | 0.35 |
| Net Debt to EBITDA | 6.42 | 1.55 | 0.78 |
| Current Ratio | 1.61 | 2.15 | 2.13 |
| Quick Ratio | 0.74 | 1.27 | 1.20 |
| Financial Leverage | 2.56 | 2.51 | 2.34 |
Bunge's decreasing debt figures suggest strengthening financial metrics, promoting investor confidence in its long-term capabilities to service debt obligations.
🏦 Fundamental Strength & Profitability
Analyses of key profitability indicators shed light on Bunge's competitive positioning and ability to generate returns on equity and assets. High profitability margins support ongoing shareholder distributions and reinvestment strategies.
| Year | 2025 | 2024 | 2023 |
|---|---|---|---|
| Return on Equity | 4.70% | 11.47% | 20.67% |
| Return on Assets | 1.83% | 4.57% | 8.84% |
| Margins: Net, EBIT, EBITDA, Gross | 1.16%, 2.51%, 3.50%, 4.85% | 2.14%, 3.76%, 4.64%, 6.39% | 3.77%, 5.99%, 6.75%, 8.14% |
| Research & Development to Revenue | 0% | 0% | 0% |
The diverse profitability metrics highlight pronounced improvements, specifically in recent years, bolstering its capability to maintain strong dividend payouts.
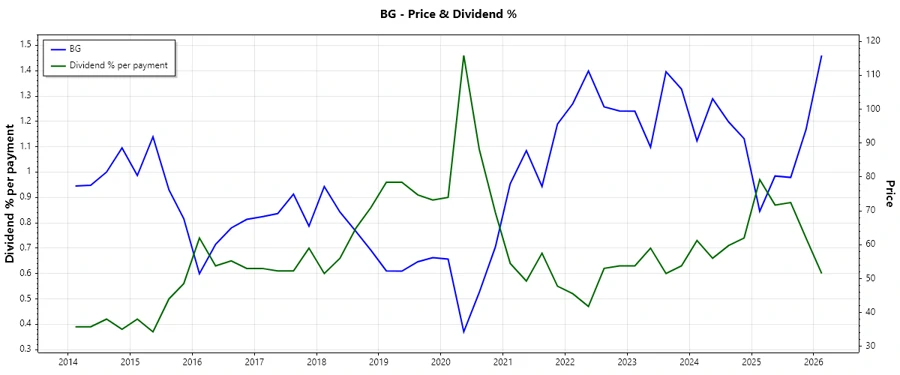
📉 Price Development
✅ Dividend Scoring System
| Criteria | Score | |
|---|---|---|
| Dividend yield | 3 | |
| Dividend Stability | 5 | |
| Dividend growth | 4 | |
| Payout ratio | 2 | |
| Financial stability | 4 | |
| Dividend continuity | 5 | |
| Cashflow Coverage | 3 | |
| Balance Sheet Quality | 4 |
Total: 30/40
🔍 Rating
Overall, Bunge Global S.A. showcases a solid dividend profile underscored by its long history of reliable payouts and strategic fiscal policies. While certain facets, such as payout ratio stress, warrant attention, the company’s financial stability and committed growth trajectory commend it as a steady choice for dividend-focused portfolios.