November 05, 2025 a 11:31 am
📊 BG: Dividend Analysis - Bunge Global S.A.
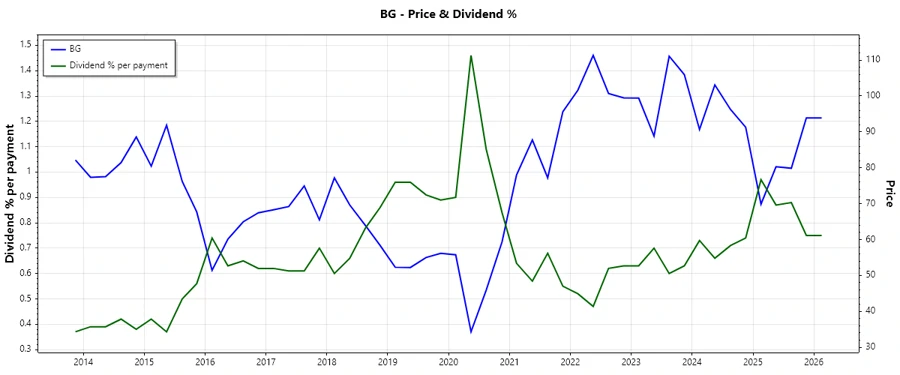
Bunge Global S.A. is a leading agribusiness and food company that has demonstrated a robust dividend profile over many years. With a history of 26 years of dividend distributions, the company's current dividend yield stands at 2.98%. Despite a recent dividend cut, the company promises steady growth in the long term. Investors should consider the inherent risks and past payout consistency in making informed investment decisions. The payout ratios indicate a sustainable dividend payment ability.
🗣️ Overview
The overview of Bunge Global S.A. highlights its position in the staple sector with a dividend yield of 2.98%. The company offers a current dividend per share of $2.71 and has an impressive history of dividend payments lasting 26 years. Despite a recent suspension in 2026, the company's long-term record shows commitment to sharing profits with its shareholders.
| Metric | Detail |
|---|---|
| Sector | Staples |
| Dividend Yield | 2.98% |
| Current Dividend per Share | $2.71 |
| Dividend History | 26 years |
| Last Cut or Suspension | 2026 |
📈 Dividend History
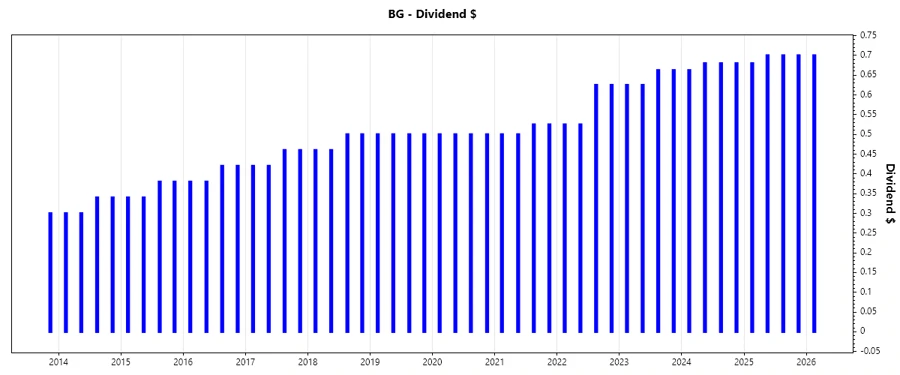
Bunge Global S.A. has consistently increased dividends over a historical span, indicating financial health and shareholder value orientation. A strong dividend history is essential for evaluating a company's performance and its potential for future growth.
| Year | Dividend per Share (USD) |
|---|---|
| 2026 | 0.70 |
| 2025 | 2.78 |
| 2024 | 2.70 |
| 2023 | 2.58 |
| 2022 | 2.30 |
📉 Dividend Growth
Analyzing dividend growth provides insight into the company’s long-term financial strategies and potential shareholder returns. Understanding these trends can help gauge future payout increases.
| Time | Growth |
|---|---|
| 3 years | 9.65% |
| 5 years | 6.21% |
The average dividend growth is 6.21% over 5 years. This shows moderate but steady dividend growth.
✅ Payout Ratio
Payout ratios reveal the portion of earnings distributed as dividends. They are crucial in assessing dividend sustainability. A low payout ratio indicates room for increased payouts or reinvestment into the company.
| Key figure | Ratio |
|---|---|
| EPS-based | 26.72% |
| Free cash flow-based | -101.05% |
With a low EPS-based payout ratio of 26.72%, Bunge Global ensures a sustainable dividend policy. However, the FCF-based payout ratio of -101.05% indicates potential short-term cash flow challenges.
💹 Cashflow & Capital Efficiency
Cash flow indicators highlight a company’s ability to generate sufficient liquidity, manage capital investment, and support ongoing financial commitments. These metrics are integral to understanding overall financial health.
| Year | 2024 | 2023 | 2022 |
|---|---|---|---|
| Free Cash Flow Yield | 4.83% | 14.55% | -41.14% |
| Earnings Yield | 10.47% | 14.93% | 10.85% |
| CAPEX to Operating Cash Flow | 72.42% | 33.92% | -10.00% |
| Stock-based Compensation to Revenue | 0.12% | 0.12% | 0.10% |
| Free Cash Flow / Operating Cash Flow Ratio | 27.58% | 66.08% | 110.00% |
While Bunge Global S.A. demonstrates fluctuating cash flow metrics, efforts to stabilize CAPEX and manage compensation relate positively to their operating efficiency.
📉 Balance Sheet & Leverage Analysis
Balance sheet metrics are critical in evaluating a company's financial stability, debt management, and liquidity. Low leverage ratios enhance the firm's ability to absorb financial shocks.
| Year | 2024 | 2023 | 2022 |
|---|---|---|---|
| Debt-to-Equity | 71.81% | 53.05% | 60.96% |
| Debt-to-Assets | 28.59% | 22.69% | 22.88% |
| Debt-to-Capital | 41.80% | 34.66% | 37.87% |
| Net Debt to EBITDA | 1.75 | 0.79 | 1.57 |
| Current Ratio | 2.15 | 2.13 | 1.75 |
| Quick Ratio | 1.27 | 1.20 | 0.87 |
| Financial Leverage | 2.51 | 2.34 | 2.66 |
Bunge Global displays a prudent debt structure with improved liquidity ratios, suggesting durable financial health capable of withstanding leverage risks.
📊 Fundamental Strength & Profitability
Analyzing profitability and fundamental strength is vital for understanding a company's ability to maintain operations efficiently and return value to shareholders.
| Year | 2024 | 2023 | 2022 |
|---|---|---|---|
| Return on Equity | 11.47% | 20.67% | 17.45% |
| Return on Assets | 4.57% | 8.84% | 6.55% |
| Net Profit Margin | 2.14% | 3.77% | 2.39% |
| Gross Margin | 6.39% | 8.14% | 5.48% |
| EBIT Margin | 3.76% | 5.99% | 3.67% |
| EBITDA Margin | 4.64% | 6.75% | 4.28% |
| R&D to Revenue | 0.06% | 0.00% | 0.00% |
Bunge Global showcases strong profitability indicators with solid returns on equity and assets, reinforced by consistent margin management across recent years.
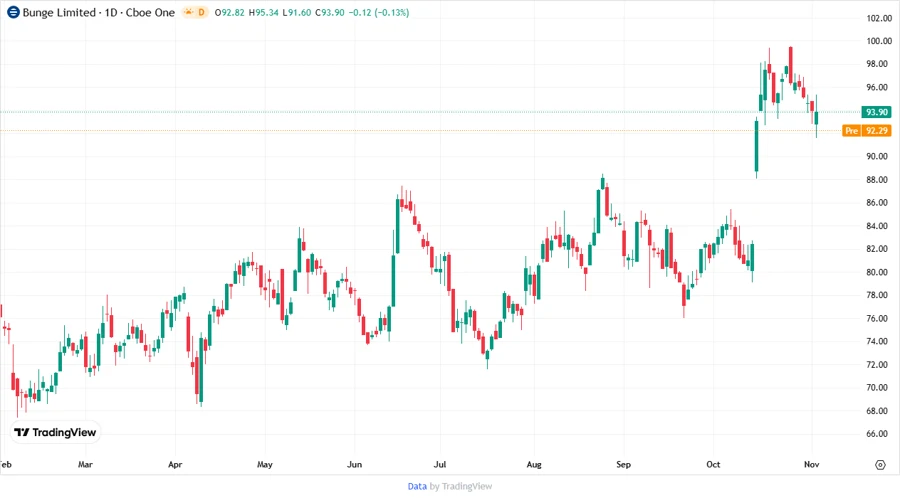
📈 Price Development
⚠️ Dividend Scoring System
| Category | Score | Bar |
|---|---|---|
| Dividend yield | 3 | |
| Dividend Stability | 4 | |
| Dividend Growth | 3 | |
| Payout Ratio | 4 | |
| Financial Stability | 4 | |
| Dividend Continuity | 5 | |
| Cashflow Coverage | 2 | |
| Balance Sheet Quality | 4 |
Overall Score: 29/40
✅ Rating
Bunge Global S.A. presents a resilient financial profile and an attractive dividend history, though it has recently faced cash flow challenges. It displays strong leverage management and steady profitability, resulting in an overall solid investment proposition for risk-tolerant investors seeking long-term growth. Given its current performance and available metrics, it holds a moderate recommendation with potential for improvement.
Smart Data Insight
Master the Perfect Entry & Exit for this Stock
Don't leave your profits to chance. Historically, this stock follows specific seasonal patterns that institutional traders use to maximize returns.
- ✅ Identify the "Golden Buying Window"
- ✅ Avoid high-risk correction cycles
- ✅ Backtested data from the last 20+ years