May 17, 2026 a 10:15 am

BF-B: Fibunacci Analysis - Brown-Forman Corporation
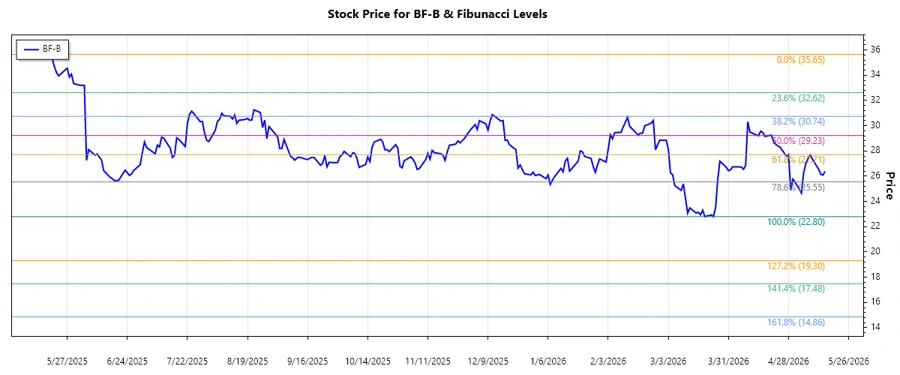
The stock of Brown-Forman Corporation has recently experienced a downturn, characterized by a prominent downward trend. The company's broad portfolio, such as Jack Daniel's and other renowned brands, presents stable prospects. However, market conditions have intensified competitive pressures. This analysis delves into the recent price movements to assess potential support or resistance levels, using Fibonacci retracement as a technical tool.
Fibunacci Analysis
| Details | Information |
|---|---|
| Analysis Period (Date Range) | 2025-05-19 to 2026-05-15 |
| High (Price and Date) | $35.65 on 2025-05-19 |
| Low (Price and Date) | $22.8 on 2026-03-20 |
| Fibonacci Level | Price |
|---|---|
| 0.236 | $26.289 |
| 0.382 | $28.315 |
| 0.5 | $29.225 |
| 0.618 | $31.135 |
| 0.786 | $33.081 |
The current price of $26.38 is near the 0.236 Fibonacci retracement level, suggesting a potential retracement zone. If the price stabilizes above this level, it may signal a position of support; however, if it falls below, it may indicate further downside potential.
Conclusion
The recent decline in Brown-Forman Corporation's stock necessitates careful observation. Despite the company's strong brand portfolio, the prevailing market trend reflects challenges likely driven by macroeconomic factors. The stock's positioning around a significant Fibonacci level indicates a crucial juncture. Analysts must monitor if the recent support level holds, as failure to do so might extend the downward trajectory. Conversely, a bounce could indicate a corrective phase, suggesting renewed investor confidence. Prospects hinge on broader market conditions and internal strategizing to capitalize on well-recognized brands.
Smart Data Insight
Master the Perfect Entry & Exit for this Stock
Don't leave your profits to chance. Historically, this stock follows specific seasonal patterns that institutional traders use to maximize returns.
- ✅ Identify the "Golden Buying Window"
- ✅ Avoid high-risk correction cycles
- ✅ Backtested data from the last 20+ years