
June 05, 2026 a 02:46 am
BF-B: Dividend Analysis - Brown-Forman Corporation
Brown-Forman Corporation, known for its strong portfolio in the spirits industry, maintains an impressive track record of over 42 years of dividend history. Despite a recent period of no dividends, the company's longevity suggests a robust underlying business model. Investors should note the potential for dividend reinstatement as market conditions and company strategies evolve.
📊 Overview
Brown-Forman Corporation operates within the Consumer Staples sector, committing to sustained financial growth while balancing shareholder returns through dividends. Although the current dividend per share is nil, the firm boasts a 3.61% dividend yield historically, underscoring a legacy of rewarding long-term investors. The absence of recent dividend cuts reflects financial discipline, crucial for maintaining investor confidence.
| Attribute | Value |
|---|---|
| Sector | Consumer Staples |
| Dividend yield | 3.61 % |
| Current dividend per share | 0 USD |
| Dividend history | 42 years |
| Last cut or suspension | None |
🗣️ Dividend History
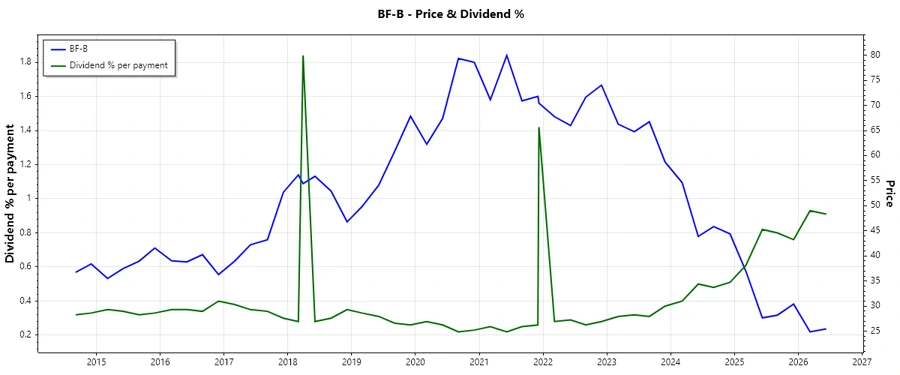
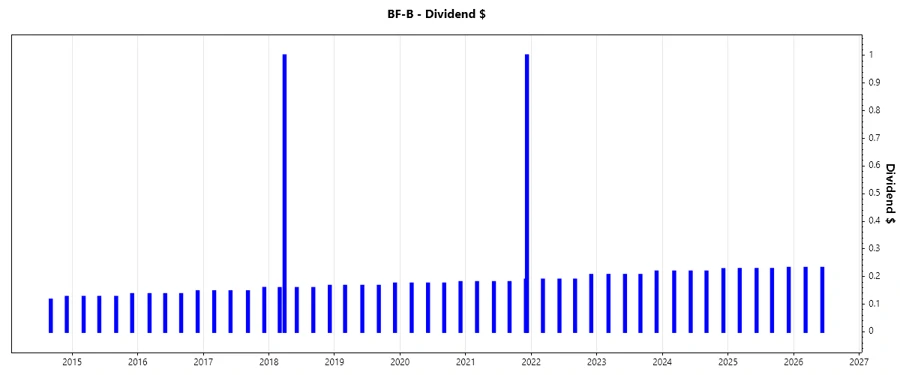
The dividend history of Brown-Forman illustrates its dedication to shareholder value, maintaining consistency for decades. Tracking dividend payments reveals the financial health and strategic priorities of the firm, especially in varying economic climates.
| Year | Dividend per Share (USD) |
|---|---|
| 2026 | 0.462 |
| 2025 | 0.912 |
| 2024 | 0.8799 |
| 2023 | 0.8343 |
| 2022 | 0.7710 |
📈 Dividend Growth
The company's focus on dividend growth is indicative of its strategic priorities and financial performance. Over the last 3 to 5 years, Brown-Forman's growth figures reflect the fiscal resilience and operational efficiency critical for sustaining investor trust.
| Time | Growth |
|---|---|
| 3 years | 5.76 % |
| 5 years | 5.36 % |
The average dividend growth is 5.36 % over 5 years. This shows moderate but steady dividend growth.
📉 Payout Ratio
The payout ratio is a vital metric for assessing dividend sustainability. With no current EPS or FCF payout detailed, Brown-Forman might be reinvesting earnings into growth areas or maintaining liquidity reserves, highlighting a prudent approach during market fluctuations.
| Key Figure | Ratio |
|---|---|
| EPS-based | 0 % |
| Free cash flow-based | 0 % |
With a 0% payout for both EPS and FCF, Brown-Forman's strategy likely prioritizes strengthening its balance sheet or funding strategic initiatives over immediate dividend payments.
✅ Cashflow & Capital Efficiency
Evaluating cash flow and capital efficiency metrics provides insight into Brown-Forman's financial robustness and operational strategy. These measures assess how efficiently the company generates cash and utilizes capital for growth.
| Metric | 2024 | 2025 |
|---|---|---|
| Free Cash Flow Yield | 1.84% | 2.62% |
| Earnings Yield | 4.49% | 5.28% |
| CAPEX to Operating Cash Flow | 35.24% | 27.93% |
| Stock-based Compensation to Revenue | 0.60% | 0.70% |
| Free Cash Flow / Operating Cash Flow Ratio | 64.76% | 72.07% |
The cashflow stability and capital utilization indicators show a trend towards efficient capital allocation and a solid cash position, which is crucial for future growth prospects.
⚠️ Balance Sheet & Leverage Analysis
Understanding balance sheet health and leverage ratios informs on Brown-Forman's financial stability and risk exposure, especially in volatile market conditions.
| Metric | 2024 | 2025 |
|---|---|---|
| Debt-to-Equity | 0.88 | 0.68 |
| Debt-to-Assets | 0.38 | 0.34 |
| Debt-to-Capital | 0.47 | 0.41 |
| Net Debt to EBITDA | 1.76 | 1.77 |
| Current Ratio | 2.59 | 3.88 |
| Quick Ratio | 0.95 | 1.56 |
| Financial Leverage | 2.32 | 2.03 |
The leverage and liquidity metrics indicate adequate financial management, with reduced reliance on debt financing, reflecting a cautiously optimistic handling of resources.
✅ Fundamental Strength & Profitability
Key profitability ratios and fundamental metrics for Brown-Forman reveal the strength of its operational framework and financial leverage, crucial for assessing future growth potential.
| Metric | 2024 | 2025 |
|---|---|---|
| Return on Equity | 29.12% | 21.76% |
| Return on Assets | 12.54% | 10.75% |
| Margins: Net | 24.51% | 21.86% |
| Margins: EBIT | 34.11% | 30.26% |
| Margins: EBITDA | 36.19% | 32.45% |
| Margins: Gross | 60.46% | 58.94% |
The solid returns on equity and assets, combined with healthy margins, demonstrate Brown-Forman's adept management of operational expenses, leading to sustained profitability.
📈 Price Development
🗣️ Dividend Scoring System
| Criterion | Score | Score Bar |
|---|---|---|
| Dividend yield | 3 | |
| Dividend Stability | 4 | |
| Dividend growth | 3 | |
| Payout ratio | 2 | |
| Financial stability | 5 | |
| Dividend continuity | 4 | |
| Cashflow Coverage | 3 | |
| Balance Sheet Quality | 4 |
Total Score: 28/40
📉 Rating
Based on our comprehensive analysis, Brown-Forman embodies solid financial health and steady profitability measures. Despite a suspension in dividend payments, long-term financial stability and strategic reinvestment suggest potential for future competitiveness and shareholder returns, warranting a HOLD recommendation pending the reinstatement of dividends.
Smart Data Insight
Master the Perfect Entry & Exit for this Stock
Don't leave your profits to chance. Historically, this stock follows specific seasonal patterns that institutional traders use to maximize returns.
- ✅ Identify the "Golden Buying Window"
- ✅ Avoid high-risk correction cycles
- ✅ Backtested data from the last 20+ years