May 11, 2026 a 12:46 pm
BF-B: Dividend Analysis - Brown-Forman Corporation
📊 Brown-Forman Corporation, a prominent entity in the beverage industry, is recognized for its robust dividend profile. With a remarkable dividend history spanning 42 years, this stock boasts a notable dividend yield of 3.68%. The company's consistent dividend payouts have been a testament to its financial stability and are appealing to income-focused investors. However, its payout ratios suggest a moderate margin for dividend sustainability and growth.
Overview
🔍 The following table outlines the critical dividend metrics for Brown-Forman Corporation:
| Aspect | Details |
|---|---|
| Sector | Beverage Industry |
| Dividend Yield | 3.68% |
| Current Dividend per Share | 0.8886 USD |
| Dividend History | 42 years |
| Last Cut or Suspension | None |
Dividend History
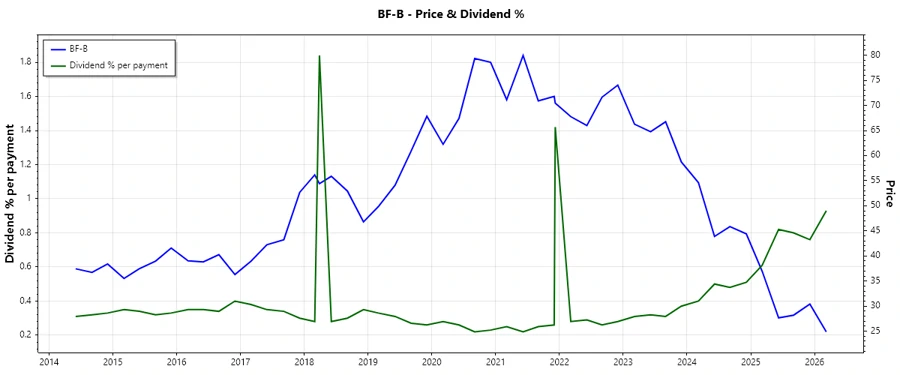
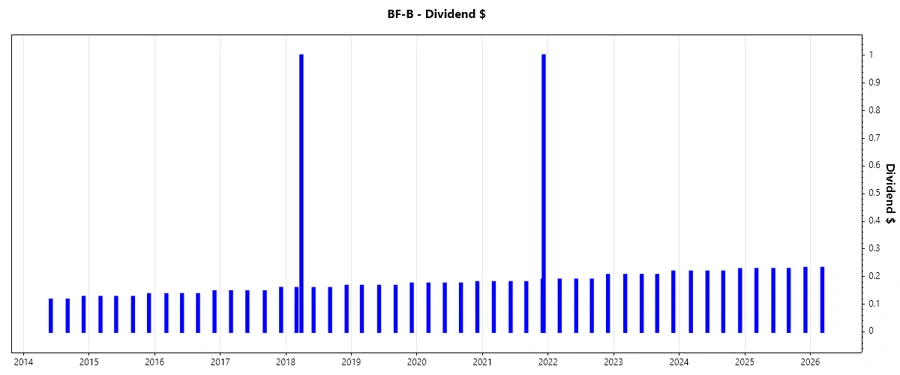
📜 Brown-Forman's dividend history has been commendable, demonstrating its commitment to rewarding shareholders. The company's ability to maintain consistent dividends over the years reflects its operational robustness and strategic foresight.
| Year | Dividend per Share (USD) |
|---|---|
| 2026 | 0.231 |
| 2025 | 0.912 |
| 2024 | 0.8799 |
| 2023 | 0.8343 |
| 2022 | 0.7710 |
Dividend Growth
🚀 Analyzing the growth of dividends over time reveals the potential for future earnings stability and shareholder value enhancement. Brown-Forman's dividend growth rates might suggest moderate increments, potentially influenced by its strategic resource allocations.
| Time | Growth |
|---|---|
| 3 years | 0.06% |
| 5 years | 0.05% |
The average dividend growth is 0.05% over 5 years. This shows moderate but steady dividend growth.
Payout Ratio
💼 The payout ratio is a vital measure indicating how well a company can sustain its dividends. Brown-Forman exhibits an EPS-based payout ratio of 52% and an FCF-based payout ratio of 57%, which are manageable and suggest that dividends are being comfortably distributed without compromising financial stability.
| Key Figure | Ratio |
|---|---|
| EPS-based | 52% |
| Free cash flow-based | 57% |
Cashflow & Capital Efficiency
💹 Adequate cash flow and capital efficiency ensure a company’s ability to fund operations and dividends sustainably. The metrics presented provide insights into Brown-Forman's financial management and resource allocation wisdom.
| Fiscal Year | 2025 | 2024 | 2023 |
|---|---|---|---|
| Free Cash Flow Yield | 0.03 | 0.02 | 0.01 |
| Earnings Yield | 0.05 | 0.04 | 0.03 |
| CAPEX to Operating Cash Flow | 0.28 | 0.35 | 0.29 |
| Stock-based Compensation to Revenue | 0.01 | 0.01 | 0.004 |
| Free Cash Flow / Operating Cash Flow Ratio | 0.72 | 0.65 | 0.71 |
🔍 These figures reflect a stable cash flow, with prudent investment in capital expenditures, which aligns with ensuring long-term operational efficiency.
Balance Sheet & Leverage Analysis
📊 A thorough balance sheet analysis unveils the company's leverage and debt management efficiency. Brown-Forman's ratios elucidate its ability to manage its debt and liquidity effectively.
| Fiscal Year | 2025 | 2024 | 2023 |
|---|---|---|---|
| Debt-to-Equity | 0.68 | 0.88 | 0.89 |
| Debt-to-Assets | 0.34 | 0.38 | 0.37 |
| Debt-to-Capital | 0.41 | 0.47 | 0.47 |
| Net Debt to EBITDA | 1.77 | 1.76 | 2.14 |
| Current Ratio | 0.00 | 2.59 | 3.51 |
| Quick Ratio | 1.56 | 0.95 | 1.40 |
| Financial Leverage | 2.03 | 2.32 | 2.38 |
💡 Generally stable debt metrics indicate effective financial management, allowing Brown-Forman to maintain sufficient liquidity while not over-leveraging.
Fundamental Strength & Profitability
📈 Examining fundamental and profitability ratios reveals Brown-Forman's efficiency and operational success. The company's solid margins and return ratios portray sustained profitability.
| Fiscal Year | 2025 | 2024 | 2023 |
|---|---|---|---|
| Return on Equity | 21.76% | 29.12% | 23.96% |
| Return on Assets | 10.75% | 12.54% | 10.07% |
| Margins: Net | 21.86% | 24.51% | 18.52% |
| EBIT | 30.26% | 34.11% | 26.18% |
| EBITDA | 32.45% | 36.19% | 28.07% |
| Gross | 58.94% | 60.46% | 58.99% |
| Research & Development to Revenue | 0% | 0% | 0% |
🌟 These figures reveal a strong profitability matrix with impressive returns on equity, indicating that the firm effectively leverages its capital.
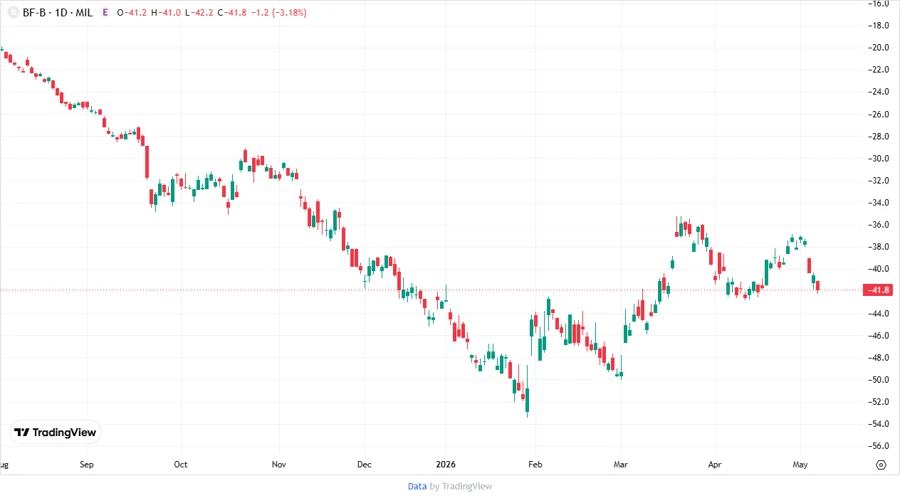
Price Development
Dividend Scoring System
🎯 The dividend scoring system evaluates multiple dimensions of financial health and dividend reliability:
| Criteria | Score | Score Bar |
|---|---|---|
| Dividend Yield | 4 | |
| Dividend Stability | 5 | |
| Dividend Growth | 3 | |
| Payout Ratio | 4 | |
| Financial Stability | 4 | |
| Dividend Continuity | 5 | |
| Cashflow Coverage | 4 | |
| Balance Sheet Quality | 4 |
Total Score: 33/40
Rating
🎖️ Brown-Forman Corporation presents a robust dividend profile featuring high stability and continuity, appealing to conservative income investors. Its moderate growth trajectory is balanced by strong financial and operational metrics, rendering it a prudent choice for dividend enthusiasts seeking reliability over high-volatility rewards.
Smart Data Insight
Master the Perfect Entry & Exit for this Stock
Don't leave your profits to chance. Historically, this stock follows specific seasonal patterns that institutional traders use to maximize returns.
- ✅ Identify the "Golden Buying Window"
- ✅ Avoid high-risk correction cycles
- ✅ Backtested data from the last 20+ years