September 03, 2025 a 03:31 am


BF-B: Dividend Analysis - Brown-Forman Corporation
Brown-Forman Corporation is a company with a robust dividend history, showcasing 41 years of continual payments, a significant mark of stability. The company's dividend yield stands at 3.11%, offering a moderate return to investors. However, recent years have seen a slight decrease in dividend growth, albeit the overall performance remains steady.
📊 Overview
The company's dividend profile is reflective of its sector norms, providing insights into its resilience and potential ROI. A consistent dividend history paired with negligible suspensions underscores financial health and management's commitment to shareholders.
| Metric | Value |
|---|---|
| Sector | Consumer Goods |
| Dividend Yield | 3.11% |
| Current Dividend Per Share | 0.89 USD |
| Dividend History | 41 years |
| Last Cut or Suspension | None |
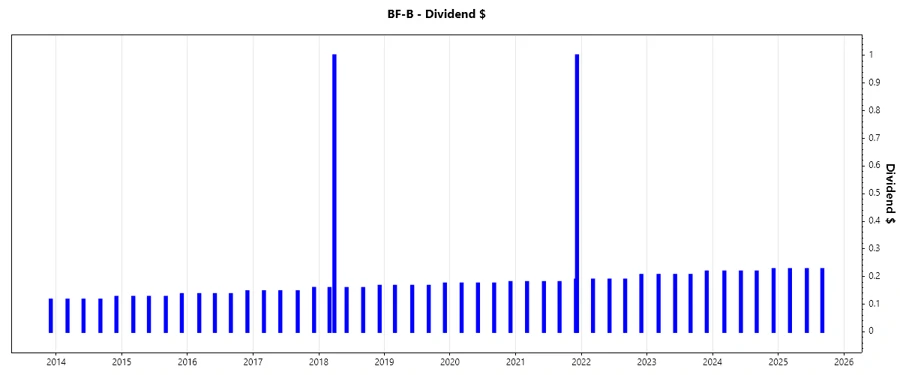
🗣️ Dividend History
A sustained dividend history is essential as it reflects the company's ability to generate sufficient profit to reward shareholders consistently. The ability to avoid cuts, especially during economic downturns, is an attractive trait for income-focused investors.
| Year | Dividend Per Share (USD) |
|---|---|
| 2025 | 0.6795 |
| 2024 | 0.8799 |
| 2023 | 0.8343 |
| 2022 | 0.7710 |
| 2021 | 1.7270 |
📈 Dividend Growth
The historical growth of dividends demonstrates a company's long-term commitment to returning profits to shareholders. Despite a minor contraction in recent periods, a 5-year average growth of 0.055% suggests sustainable yet conservative growth.
| Time | Growth |
|---|---|
| 3 years | -0.20% |
| 5 years | 0.06% |
The average dividend growth is 0.06% over 5 years. This shows moderate but steady dividend growth.
⚠️ Payout Ratio
Payout ratios are a key metric in determining the sustainability of a company's dividend program. The figures demonstrate how efficiently the company converts its earnings into dividends.
| Key Figure | Ratio |
|---|---|
| EPS-based | 48.33% |
| Free Cash Flow-based | 97.46% |
With an EPS payout ratio of 48.33%, Brown-Forman maintains a balanced approach in distributing its earnings as dividends. However, the FCF ratio of 97.46% suggests limited capacity for reinvestment without tapping into reserves, raising a potential caution flag.
✅ Cashflow & Capital Efficiency
Understanding a company's cash flow and capital efficiency provides insights into its ability to fund operations, capital projects, and return cash to shareholders without having to take on excessive debt.
| Year | 2025 | 2024 | 2023 |
|---|---|---|---|
| Free Cash Flow Yield | 2.62% | 1.84% | 1.46% |
| Earnings Yield | 5.28% | 4.49% | 2.50% |
| CAPEX to Operating Cash Flow | 27.93% | 35.24% | 28.59% |
| Stock-based Compensation to Revenue | 0.70% | 0.60% | 0.43% |
| Free Cash Flow / Operating Cash Flow | 72.07% | 64.76% | 71.41% |
The data paints a picture of a company that carefully manages its operational outflows and seeks to maintain fiscal prudence, though the low free cash flow yield suggests potential pressures.
📉 Balance Sheet & Leverage Analysis
Interpreting leverage and liquidity ratios helps gauge Brown-Forman's capacity to meet short-term obligations and assess its long-term solvency.
| Year | 2025 | 2024 | 2023 |
|---|---|---|---|
| Debt-to-Equity | 0.68 | 0.88 | 0.89 |
| Debt-to-Assets | 0.34 | 0.38 | 0.37 |
| Debt-to-Capital | 0.41 | 0.47 | 0.47 |
| Net Debt to EBITDA | 1.77 | 1.76 | 2.14 |
| Current Ratio | 3.88 | 2.59 | 3.51 |
| Quick Ratio | 1.56 | 0.95 | 1.40 |
| Financial Leverage | 2.03 | 2.32 | 2.38 |
Brown-Forman has been maintaining leverage ratios that suggest a balanced approach to utilizing debt, accompanied by healthy liquidity positions, especially in the short-term viability reflected by current and quick ratios.
💪 Fundamental Strength & Profitability
These metrics are vital to ascertain the company's inherent operational efficiency and its proficiency in generating profits.
| Year | 2025 | 2024 | 2023 |
|---|---|---|---|
| Return on Equity | 21.76% | 29.12% | 23.96% |
| Return on Assets | 10.75% | 12.54% | 10.07% |
| Margins: Net | 21.86% | 24.51% | 18.52% |
| EBIT Margin | 30.26% | 34.11% | 26.18% |
| EBITDA Margin | 32.45% | 36.19% | 28.07% |
| Gross Margin | 58.94% | 60.46% | 58.99% |
| R&D to Revenue | 0% | 0% | 0% |
The company portrays strong profitability metrics which are crucial as competitive advantages, maintaining impressive net and gross margins underlining operational efficiency.
📈 Price Development
📊 Dividend Scoring System
| Criteria | Score | Score Bar |
|---|---|---|
| Dividend Yield | 3 | |
| Dividend Stability | 5 | |
| Dividend Growth | 2 | |
| Payout Ratio | 4 | |
| Financial Stability | 4 | |
| Dividend Continuity | 5 | |
| Cashflow Coverage | 3 | |
| Balance Sheet Quality | 4 |
Total Score: 30/40
✅ Rating
Brown-Forman Corporation offers a blend of stability and moderate growth for dividend investors, albeit with cautious outlook on free cash flow utilization. It remains a sound option for those prioritizing consistent dividend income.
Smart Data Insight
Master the Perfect Entry & Exit for this Stock
Don't leave your profits to chance. Historically, this stock follows specific seasonal patterns that institutional traders use to maximize returns.
- ✅ Identify the "Golden Buying Window"
- ✅ Avoid high-risk correction cycles
- ✅ Backtested data from the last 20+ years