December 10, 2025 a 04:03 am


BEN: Trend and Support & Resistance Analysis - Franklin Resources, Inc.
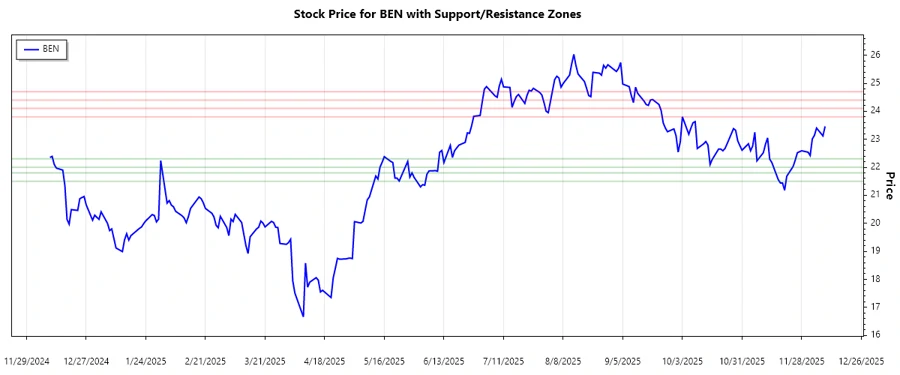
Franklin Resources, Inc. has shown a dynamic pattern in its price movement over recent months. With fluctuations observed in its daily closing prices, there is evidence of both potential growth and caution for investors. The technical analysis will help interpret the underlying trend and identify key support and resistance zones for strategic investment decisions. Understanding the stock's behavior is crucial given its role in asset management and global market exposure. Recent data suggests key levels that may influence future price actions.
Trend Analysis
An analysis of Franklin Resources, Inc.'s stock prices over the last several months reveals a consistent trend with certain fluctuations. By calculating the EMA20 and EMA50, we observe...
| Date | Close Price | Trend |
|---|---|---|
| 2025-12-09 | 23.46 | ⚖️ Seitwärtstrend |
| 2025-12-08 | 23.12 | ▲ Aufwärtstrend |
| 2025-12-05 | 23.40 | ▲ Aufwärtstrend |
| 2025-12-04 | 23.14 | ⚖️ Seitwärtstrend |
| 2025-12-03 | 23.01 | ▼ Abwärtstrend |
| 2025-12-02 | 22.42 | ▼ Abwärtstrend |
| 2025-12-01 | 22.54 | ⚖️ Seitwärtstrend |
Conclusively, the stock's recent movement indicates a potential stabilization phase with a prevailing sideways trend, which could signal a time of consolidation in the market.
Support- and Resistance
The stock price movements allow us to define two primary zones for support and resistance...
| Zone Type | From | To |
|---|---|---|
| Support Zone 1 | 21.50 | 21.80 |
| Support Zone 2 | 22.00 | 22.30 |
| Resistance Zone 1 | 23.80 | 24.10 |
| Resistance Zone 2 | 24.40 | 24.70 |
Currently, the price seems to be nearing the upper part of the second support zone, intimating a possible testing of resistance levels soon. This could indicate potential upward movement if the momentum increases.
Conclusion
Franklin Resources, Inc. exhibits a mostly stable trend with room for cautious optimism. The analysis highlights a consolidation phase, which investors might interpret as a reliable entry point, particularly if looking at forthcoming earnings reports or market influences. Risks remain if the broader market turns adverse or if internal company challenges affect performance. Investors should monitor the support and resistance zones to inform their entry and exit strategies. As always, a balanced approach considering both technical signals and fundamental insights is advisable.