November 01, 2025 a 08:15 am
BEN: Trend and Support & Resistance Analysis - Franklin Resources, Inc.
Franklin Resources, Inc. presents a dynamic investment opportunity in the asset management segment. With a long-standing history and diverse portfolio across equity, fixed income, and alternative markets, it positions itself uniquely to leverage market conditions. The recent analysis indicates potential trends that investors should be aware of, especially in terms of price movement and critical levels of support and resistance. Understanding these dynamics can significantly impact investment decisions.
Trend Analysis
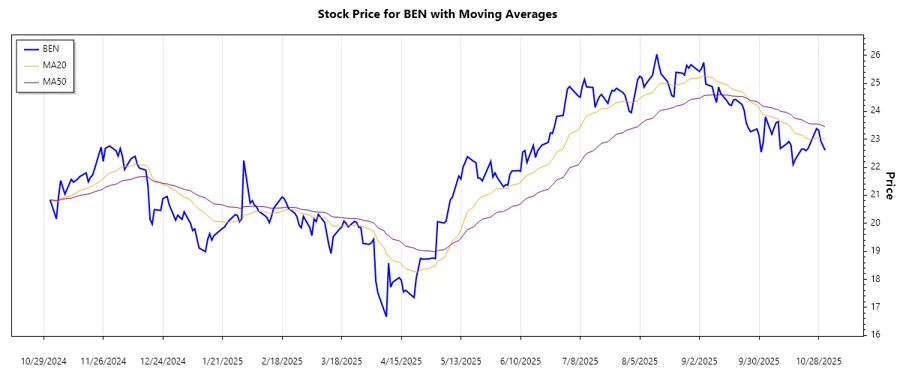
Analyzing the closing prices over the past few months, the calculated EMAs indicate the following trends:
| Date | Closing Price | Trend |
|---|---|---|
| 2025-10-31 | 22.61 | ▼ |
| 2025-10-30 | 22.77 | ▼ |
| 2025-10-29 | 22.94 | ▼ |
| 2025-10-28 | 23.32 | ▼ |
| 2025-10-27 | 23.38 | ▼ |
| 2025-10-24 | 22.84 | ▼ |
| 2025-10-23 | 22.67 | ▼ |
The dominant trend is a downward movement as indicated by a consistent EMA20 below EMA50. This signals potential bearish momentum, with prices showing resilience across a declining scale.
Support and Resistance
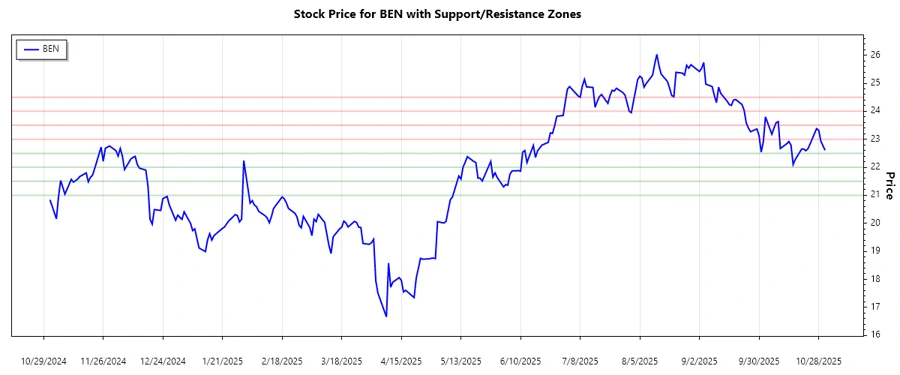
Based on the closing prices, the calculated support and resistance levels are as follows:
| Zone Category | From | To |
|---|---|---|
| Support Zone 1 | 22.00 | 22.50 |
| Support Zone 2 | 21.00 | 21.50 |
| Resistance Zone 1 | 23.00 | 23.50 |
| Resistance Zone 2 | 24.00 | 24.50 |
The current price at $22.61 suggests proximity to the lower support level, indicating potential for either bounce or breakdown through this zone.
Conclusion
Franklin Resources, Inc. demonstrates clear signals indicating a bearish trend with notable resistance and support zones. Short-term opportunities may present themselves, given the proximity to key support levels. Long-term investors should exercise caution, mindful of the trends and potential market reversals. A sophisticated understanding of these technical indicators can greatly aid in managing risk exposure and optimizing portfolio performance.
Smart Data Insight
Master the Perfect Entry & Exit for this Stock
Don't leave your profits to chance. Historically, this stock follows specific seasonal patterns that institutional traders use to maximize returns.
- ✅ Identify the "Golden Buying Window"
- ✅ Avoid high-risk correction cycles
- ✅ Backtested data from the last 20+ years