November 24, 2025 a 10:15 am
BEN: Fibonacci Analysis - Franklin Resources, Inc.
Franklin Resources, Inc. (BEN) has witnessed significant momentum driven by market conditions and internal strategic shifts. The asset management firm's adaptability to market trends has influenced its recent price performance. Observing technical indicators such as the Fibonacci retracement could offer insights into its potential future price movements and provide traders with additional levels for anticipating support or resistance.
Fibonacci Analysis
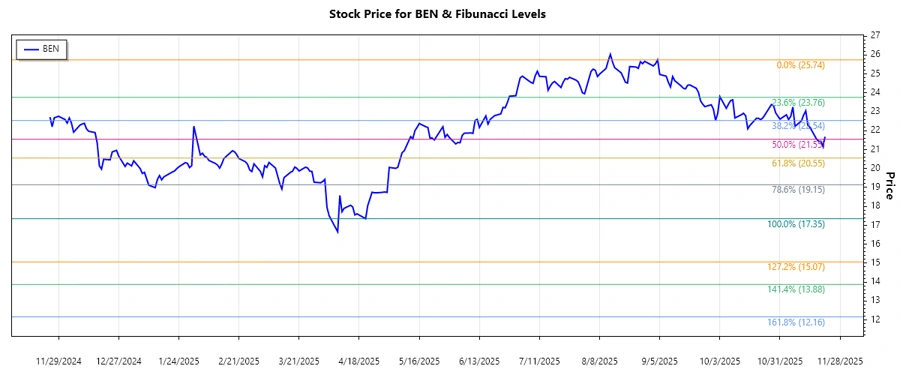
The following analysis highlights the dominant downtrend observed over recent months in Franklin Resources, Inc. (BEN). Using the highest and lowest stock price points, we have calculated the Fibonacci retracement levels, which offer key insights into potential price action scenarios.
| Start Date | End Date | High Price | Low Price |
|---|---|---|---|
| 2024-11-25 | 2025-11-21 | $25.74 on 2025-09-04 | $17.35 on 2025-04-21 |
| Fibonacci Level | Price Level |
|---|---|
| 0.236 | $19.91 |
| 0.382 | $21.58 |
| 0.5 | $23.55 |
| 0.618 | $22.48 |
| 0.786 | $24.73 |
Currently, the stock price seems to be navigating within the 0.382 retracement area. This suggests moderate resistance, potentially reverting to a natural support zone, signaling a critical observation point for traders.
The positioning of the current price in this retracement range may indicate a consolidation phase before further trend development, either upwards or downwards, highlighting key price reactions at these levels.
Conclusion
The ongoing downtrend in Franklin Resources, Inc., from its high of $25.74 to a current level of $21.18, frames a narrative of adjusting market sentiments and asset revaluation. While Fibonacci levels offer technical buffers that could serve as resistance or support, the anticipation of volatility cannot be understated. Analysts should consider both macroeconomic indicators and the firm's strategic endeavors in asset management to fully understand potential opportunities and risks. The retracement zone serves as a deliberation area where asset reflexivity is imminent, guiding informed decision-making.
Smart Data Insight
Master the Perfect Entry & Exit for this Stock
Don't leave your profits to chance. Historically, this stock follows specific seasonal patterns that institutional traders use to maximize returns.
- ✅ Identify the "Golden Buying Window"
- ✅ Avoid high-risk correction cycles
- ✅ Backtested data from the last 20+ years