July 21, 2025 a 03:15 pm

BEN: Fibonacci Analysis - Franklin Resources, Inc.
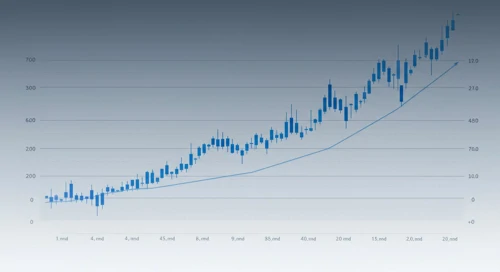
Franklin Resources, Inc., known for its expertise in asset management, has witnessed a notable stock trend. Recent data indicates a bullish movement from April 2025 to July 2025. The current price is approaching key Fibonacci levels, suggesting potential support. Investors should monitor these levels closely for possible entry points.
Fibonacci Analysis
| Trend Details | Value |
|---|---|
| Start Date | 2025-04-01 |
| End Date | 2025-07-21 |
| High Price | $25.14 (2025-07-10) |
| Low Price | $18.05 (2025-04-22) |
| Fibonacci Level | Price |
|---|---|
| 0.236 | $23.49 |
| 0.382 | $22.43 |
| 0.5 | $21.60 |
| 0.618 | $20.77 |
| 0.786 | $19.61 |
The current price is around $24.65, which is above the 0.236 retracement level. This indicates a strong bullish continuation potential.
Technically, the levels at 0.382 and 0.5 could act as support for possible pullback trades, while the 0.236 level has shown strength as a minor support.
Conclusion
The recent uptrend in Franklin Resources' stock price suggests a positive outlook with bullish potential. The proximity of the current price to the 0.236 retracement level implies continued upward momentum. However, any retracement should be viewed as a potential buying opportunity given the robust support levels identified. Investors ought to exercise due diligence and be mindful of market volatility. The technical indicators lean towards potential gains, but external factors could temper expectations.
Smart Data Insight
Master the Perfect Entry & Exit for this Stock
Don't leave your profits to chance. Historically, this stock follows specific seasonal patterns that institutional traders use to maximize returns.
- ✅ Identify the "Golden Buying Window"
- ✅ Avoid high-risk correction cycles
- ✅ Backtested data from the last 20+ years