
July 01, 2026 a 03:31 am

BEN: Dividend Analysis - Franklin Resources, Inc.
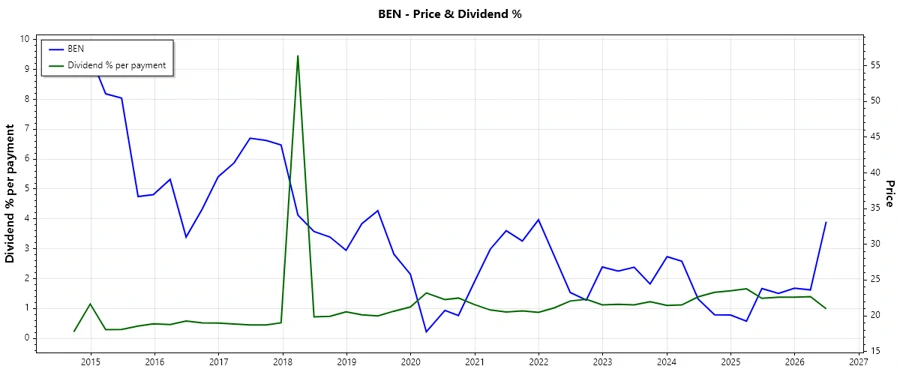
The dividend profile of Franklin Resources, Inc. showcases a strong long-term dividend history with a favorable yield, albeit surrounded by certain risks in payout sustainability as reflected by its high payout ratios. Investors seeking steady income streams may find its consistent dividend growth compelling.
📊 Overview
Franklin Resources operates in the financial sector and offers a notable dividend yield of 3.95%. The current dividend per share stands at 1.33 USD, sustained over an impressive 43-year history with no recent cuts or suspensions.
| Metric | Value |
|---|---|
| Sector | Financial |
| Dividend Yield | 3.95% |
| Current Dividend per Share | 1.33 USD |
| Dividend History | 43 years |
| Last Cut or Suspension | None |
📉 Dividend History
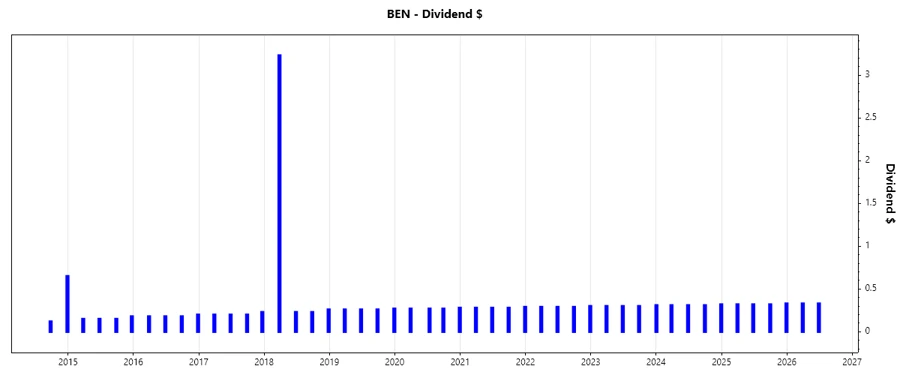
A long and stable dividend payment history is critical for investors focusing on income generation. Consistency in dividend payouts over the years signals financial robustness and management's commitment to returning capital to shareholders.
| Year | Dividend per Share (USD) |
|---|---|
| 2026 | 0.66 |
| 2025 | 1.29 |
| 2024 | 1.56 |
| 2023 | 0.90 |
| 2022 | 1.17 |
📈 Dividend Growth
Dividend growth is a key indicator of a company's increasing profitability and financial health, reflecting its potential to continue rewarding shareholders with higher payouts.
| Time | Growth |
|---|---|
| 3 years | 3.31% |
| 5 years | 3.43% |
The average dividend growth is 3.43% over 5 years. This shows moderate but steady dividend growth.
✅ Payout Ratio
Payout ratios help evaluate the sustainability of dividends, providing insights into whether earnings and cash flows suffice to maintain dividend payouts over time.
| Key Figure | Ratio |
|---|---|
| EPS-based | 84.69% |
| Free cash flow-based | 74.27% |
With the EPS payout ratio at 84.69% and the FCF payout ratio at 74.27%, sustainability risks may arise if earnings do not grow to support this high distribution level.
💡 Cashflow & Capital Efficiency
CFO performance provides insights into a company's ability to cover dividends through internal funds, while capital efficiency ratios reflect its investment effectiveness and resource utilization.
| Year | 2025 | 2024 | 2023 |
|---|---|---|---|
| Free Cash Flow Yield | 7.66% | 7.74% | 7.81% |
| Earnings Yield | 4.41% | 4.53% | 7.33% |
| CAPEX to Operating Cash Flow | 14.49% | 18.23% | 13.66% |
| Stock-based Comp. to Revenue | 2.45% | 2.90% | 2.33% |
| Free Cash Flow / Operating CF Ratio | 85.51% | 81.77% | 86.34% |
The strong free cash flow and capital efficiency suggest sound operational strategy, but heavy reliance on stock-based compensation indicates potential employee retention strategies.
🗣️ Balance Sheet & Leverage Analysis
The company's balance sheet and leverage ratios assess financial flexibility and credit risk, essential for maintaining strategic and operational stability.
| Year | 2025 | 2024 | 2023 |
|---|---|---|---|
| Debt-to-Equity | 1.10 | 1.05 | 0.99 |
| Debt-to-Assets | 0.41 | 0.40 | 0.39 |
| Debt-to-Capital | 0.52 | 0.51 | 0.50 |
| Net Debt to EBITDA | 6.68 | 6.31 | 3.85 |
| Current Ratio | 17.14 | 0.00 | 0.00 |
| Quick Ratio | 2.71 | 3.24 | 4.13 |
| Financial Leverage | 2.68 | 2.60 | 2.53 |
With a high current ratio and improving net debt metrics, Franklin Resources exhibits solid liquidity, although debt levels remain significant, requiring cautious management in volatile markets.
🌟 Fundamental Strength & Profitability
Evaluating profitability through returns and margins is crucial in assessing a company's capacity to generate earnings relative to its capital base.
| Year | 2025 | 2024 | 2023 |
|---|---|---|---|
| Return on Equity | 4.35% | 3.72% | 7.41% |
| Return on Assets | 1.62% | 1.43% | 2.93% |
| Net Margin | 5.98% | 5.48% | 11.25% |
| EBIT Margin | 10.05% | 10.86% | 18.62% |
| EBITDA Margin | 16.12% | 16.22% | 24.30% |
| Gross Margin | 80.34% | 80.11% | 80.90% |
| R&D to Revenue | 0.00% | 0.00% | 0.00% |
Margins and returns display satisfactory levels of profitability, however, consistent attention to cost management is necessary due to cyclical fluctuations in financial performance.
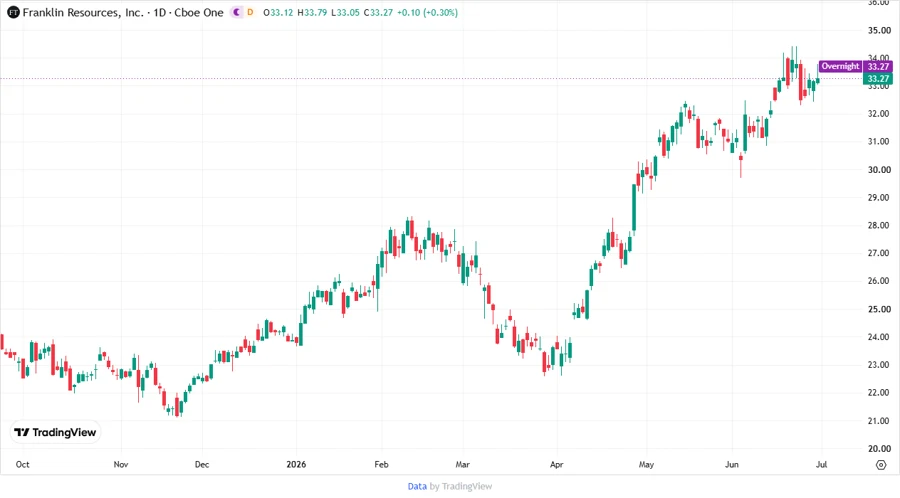
📈 Price Development
💹 Dividend Scoring System
| Criteria | Description | Score |
|---|---|---|
| Dividend Yield | Relatively Attractive | 4/5 |
| Dividend Stability | Consistent | 5/5 |
| Dividend Growth | Moderate Growth | 3/5 |
| Payout Ratio | High Distribution | 2/5 |
| Financial Stability | Good Liquidity | 4/5 |
| Dividend Continuity | Robust Record | 4/5 |
| Cashflow Coverage | Well Managed | 4/5 |
| Balance Sheet Quality | Stable | 3/5 |
Overall Score: 29/40
📊 Rating
Franklin Resources, Inc. presents a stable dividend-paying opportunity, ideally suited for investors valuing long-term income with moderate growth expectations. While the high payout ratios warrant caution, the robust dividend history and reasonable financial stability underscore its potential as a reliable income-generating stock.
Smart Data Insight
Master the Perfect Entry & Exit for this Stock
Don't leave your profits to chance. Historically, this stock follows specific seasonal patterns that institutional traders use to maximize returns.
- ✅ Identify the "Golden Buying Window"
- ✅ Avoid high-risk correction cycles
- ✅ Backtested data from the last 20+ years