
June 09, 2026 a 02:46 am

BEN: Dividend Analysis - Franklin Resources, Inc.
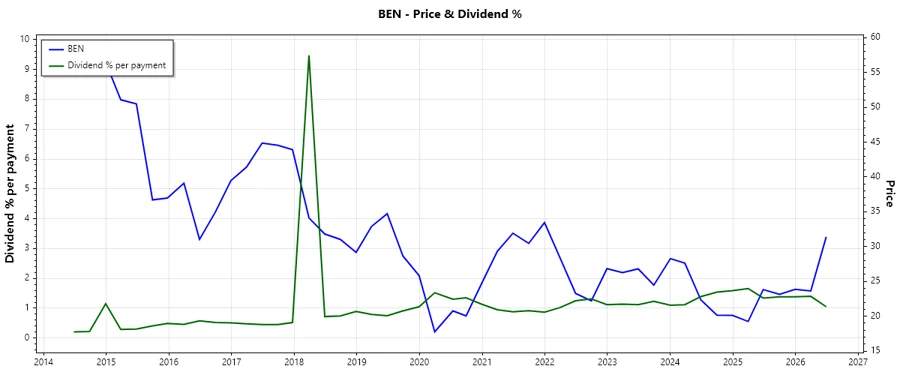
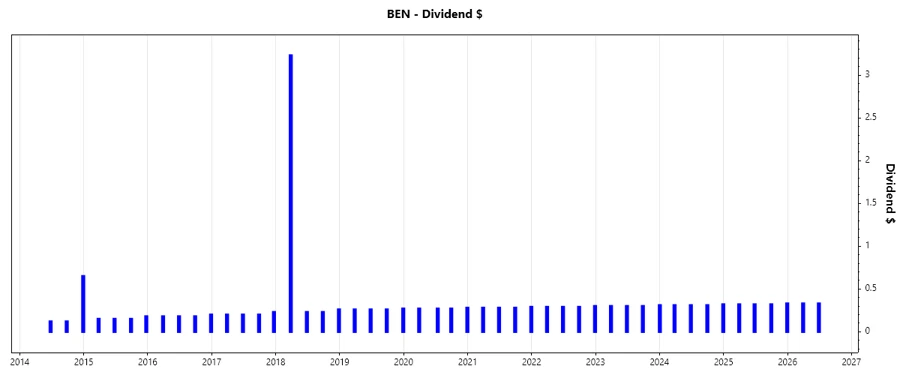
Franklin Resources, Inc., a leading global investment management organization, demonstrates a robust dividend profile. With a market capitalization of over $16 billion, the company has consistently provided investors with reliable dividends. The firm's commitment to dividends, shown by its 43-year history without a cut or suspension, highlights its stability as a dividend-paying entity.
📊 Overview
Franklin Resources, Inc. operates in the financial sector, currently offering a dividend yield of 4.17%. The current dividend per share stands at $1.33 USD. With a solid track record of 43 years of dividend payments, this company is a strong choice for income-focused investors.
| Metric | Detail |
|---|---|
| Sector | Financial |
| Dividend Yield | 4.17% |
| Current Dividend per Share | $1.33 |
| Dividend History | 43 years |
| Last Cut or Suspension | None |
🗣️ Dividend History
Analyzing dividend history is crucial for evaluating the reliability of dividend income. Franklin Resources, Inc. has maintained dividend payments for over four decades, demonstrating a commitment to rewarding shareholders.
| Year | Dividend per Share (USD) |
|---|---|
| 2026 | 0.66 |
| 2025 | 1.29 |
| 2024 | 1.56 |
| 2023 | 0.90 |
| 2022 | 1.17 |
📈 Dividend Growth
Dividend growth reflects the company’s ability to increase shareholder value over time. Steady growth is a positive sign of a company's financial health and commitment to its dividend policy.
| Time | Growth |
|---|---|
| 3 years | 3.31% |
| 5 years | 3.43% |
The average dividend growth is 3.43% over 5 years. This shows moderate but steady dividend growth.
⚠️ Payout Ratio
The payout ratio helps assess whether a company can sustain its dividends. A high payout ratio can indicate risk if earnings decline, while a moderate ratio suggests sustainability.
| Key Figure | Ratio |
|---|---|
| EPS-based | 84.69% |
| Free Cash Flow-based | 74.27% |
The EPS-based payout ratio of 84.69% is relatively high, suggesting a possible strain on earnings. However, the Free Cash Flow-based ratio of 74.27% is more moderate, indicating a better alignment with cash flow efficiency.
💰 Cashflow & Capital Efficiency
Cashflow and capital efficiency are critical for assessing operational effectiveness and the potential for sustaining dividends. They reflect how well a company manages its finances and reinvests in growth.
| Metric | 2023 | 2024 | 2025 |
|---|---|---|---|
| Free Cash Flow Yield | 7.81% | 7.74% | 7.66% |
| Earnings Yield | 7.33% | 4.53% | 4.41% |
| CAPEX to Operating Cash Flow | 13.66% | 18.23% | 14.49% |
| Stock-based Compensation to Revenue | 2.33% | 2.90% | 2.45% |
| Free Cash Flow / Operating Cash Flow Ratio | 86.34% | 81.77% | 85.51% |
The cashflow ratios suggest that Franklin Resources manages its expenses well, maintaining a stable cash position. The free cash flow yield is consistent over the years, indicating strong operational efficiency.
⚖️ Balance Sheet & Leverage Analysis
A company's balance sheet health is vital for evaluating its ability to meet long-term financial obligations. Leverage ratios provide insight into the company's debt utilization relative to equity and assets.
| Ratio | 2023 | 2024 | 2025 |
|---|---|---|---|
| Debt-to-Equity | 0.99 | 1.05 | 1.10 |
| Debt-to-Assets | 39.02% | 40.31% | 41.09% |
| Debt-to-Capital | 49.65% | 51.13% | 52.41% |
| Net Debt to EBITDA | 3.85 | 6.31 | 6.88 |
| Current Ratio | 4.13 | 3.24 | 2.71 |
| Quick Ratio | 4.13 | 3.24 | 2.71 |
| Financial Leverage | 2.53 | 2.60 | 2.68 |
The leverage ratios indicate a high reliance on debt financing, with increasing debt-to-equity ratios. While current and quick ratios are strong, a careful watch on debt levels is advisable.
✅ Fundamental Strength & Profitability
Fundamental metrics assess the company's economic strength and profitability. High returns on equity and assets are indicators of efficient management and operational prowess.
| Metric | 2023 | 2024 | 2025 |
|---|---|---|---|
| Return on Equity | 7.41% | 3.72% | 4.35% |
| Return on Assets | 2.93% | 1.43% | 1.62% |
| Margins: Net | 11.25% | 5.48% | 5.98% |
| Margins: EBIT | 18.62% | 10.86% | 10.05% |
| Margins: EBITDA | 24.30% | 16.22% | 16.12% |
| Margins: Gross | 80.90% | 80.11% | 80.34% |
| Research & Development to Revenue | 0% | 0% | 0% |
Franklin Resources shows moderate profitability, with consistent gross margins and improving ROE by 2023, reflecting positive management strategies and cost efficiency.
📉 Price Development
🎯 Dividend Scoring System
| Category | Score | Indicator |
|---|---|---|
| Dividend Yield | 4 | |
| Dividend Stability | 5 | |
| Dividend Growth | 3 | |
| Payout Ratio | 3 | |
| Financial Stability | 4 | |
| Dividend Continuity | 5 | |
| Cashflow Coverage | 4 | |
| Balance Sheet Quality | 3 |
Total Score: 31/40
⭐️ Rating
Franklin Resources, Inc. exhibits a strong dividend profile, underpinned by decades of reliable payments and moderate growth potential. While some leverage exists, overall financial health and consistent cash flow generation support its dividend policy. It is recommended for investors seeking stable income with moderate growth prospects.
Smart Data Insight
Master the Perfect Entry & Exit for this Stock
Don't leave your profits to chance. Historically, this stock follows specific seasonal patterns that institutional traders use to maximize returns.
- ✅ Identify the "Golden Buying Window"
- ✅ Avoid high-risk correction cycles
- ✅ Backtested data from the last 20+ years