May 20, 2026 a 03:30 am
BEN: Dividend Analysis - Franklin Resources, Inc.
Franklin Resources, Inc. presents an appealing dividend profile with a substantial track record. Having maintained a dividend history over 43 years, the company exhibits resilience and commitment towards its shareholders. While it currently offers a high dividend yield of 5.50%, prospective investors should consider both the payout ratios and historical growth to gauge future sustainability and growth potential.
Overview 📊
Franklin Resources operates within the financial sector, offering a dividend yield of 5.50% with a current dividend per share of 1.33 USD. The company has an impressive 43-year dividend history and has not recently cut or suspended its dividends, indicating consistent shareholder returns.
| Aspect | Details |
|---|---|
| Sector | Financials |
| Dividend yield | 5.50% |
| Current dividend per share | 1.33 USD |
| Dividend history | 43 years |
| Last cut or suspension | None |
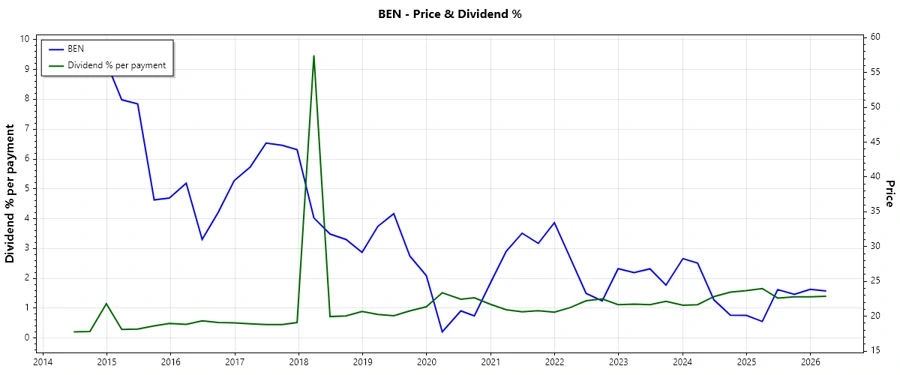
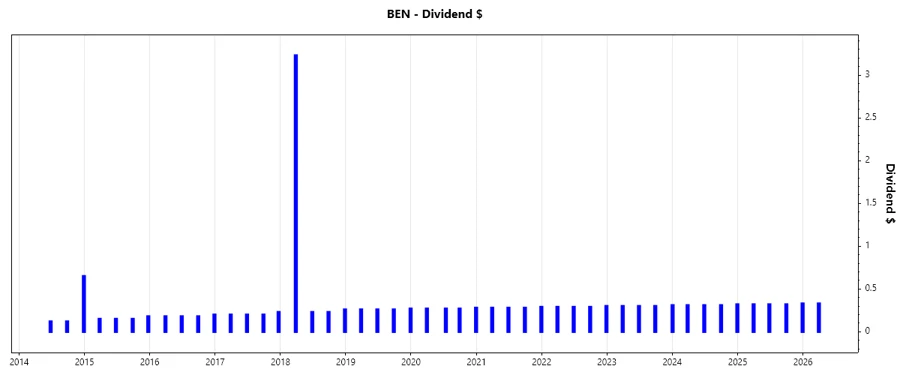
Dividend History 🗣️
Understanding dividend history is crucial for projecting future income potential. With consistent increases over the years, Franklin Resources stands as a testament to reliability.
| Year | Dividend Per Share |
|---|---|
| 2026 | 0.33 USD |
| 2025 | 1.29 USD |
| 2024 | 1.56 USD |
| 2023 | 0.90 USD |
| 2022 | 1.17 USD |
Dividend Growth 📈
The growth rate of dividends reflects a company’s ability to enhance shareholder value over time. With a 3-year growth rate of 3.31% and 5-year growth of 3.43%, the company exhibits moderate stability, highlighting slowly increasing shareholder returns.
| Time | Growth |
|---|---|
| 3 years | 3.31% |
| 5 years | 3.43% |
The average dividend growth is 3.43% over 5 years. This shows moderate but steady dividend growth.
Payout Ratio 📉
Payout ratios determine how well earnings support dividends and potentially growth. Currently, Franklin Resources has an EPS-based payout ratio of 84.69% and a free cash flow-based ratio of 74.27%, indicating a significant share of earnings is allocated to dividends but still manageable.
| Key figure | Ratio |
|---|---|
| EPS-based | 84.69% |
| Free cash flow-based | 74.27% |
The high payout ratios reflect strong dividend distributions but warrant careful consideration in conjunction with future earnings growth.
Cashflow & Capital Efficiency 💰
Assessment of cash flow and capital efficiency is crucial for determining a company’s operational performance and long-term sustainability.
| Year | 2023 | 2024 | 2025 |
|---|---|---|---|
| Free Cash Flow Yield | 7.81% | 7.74% | 7.66% |
| Earnings Yield | 7.33% | 4.52% | 4.41% |
| CAPEX to Operating Cash Flow | 13.66% | 18.23% | 14.49% |
| Stock-based Compensation to Revenue | 2.33% | 2.90% | 2.45% |
| Free Cash Flow / Operating Cash Flow Ratio | 86.34% | 81.77% | 85.51% |
The data shows stable cash flows and capital allocation supporting Franklin Resources’ investment in operations, maintaining profitable growth prospects.
Balance Sheet & Leverage Analysis 📋
Analyzing the balance sheet and leverage gives insights into financial stability and credit risk. With figures well balanced, Franklin Resources shows sound financial health.
| Year | 2023 | 2024 | 2025 |
|---|---|---|---|
| Debt-to-Equity | 0.99 | 1.05 | 1.10 |
| Debt-to-Assets | 0.39 | 0.40 | 0.41 |
| Debt-to-Capital | 0.50 | 0.51 | 0.52 |
| Net Debt to EBITDA | 3.85 | 6.31 | 6.88 |
| Current Ratio | 4.13 | 3.24 | 2.71 |
| Quick Ratio | 4.13 | 3.24 | 2.71 |
| Financial Leverage | 2.53 | 2.60 | 2.68 |
The low leverage ratios combined with strong liquidity metrics signify robust balance sheet standards.
Fundamental Strength & Profitability 🚀
Strong fundamentals and profitability margins are vital for both present valuation and future growth prospects.
| Year | 2023 | 2024 | 2025 |
|---|---|---|---|
| Return on Equity | 7.41% | 3.72% | 4.35% |
| Return on Assets | 2.93% | 1.43% | 1.62% |
| Net Margin | 11.25% | 5.48% | 5.98% |
| EBIT Margin | 18.62% | 10.86% | 10.05% |
| EBITDA Margin | 24.30% | 16.22% | 16.12% |
| Gross Margin | 80.90% | 80.10% | 80.34% |
| R&D to Revenue | 0.00% | 0.00% | 0.00% |
The diversified profitability margins underscore an operationally efficient enterprise with strong potential for continued returns.
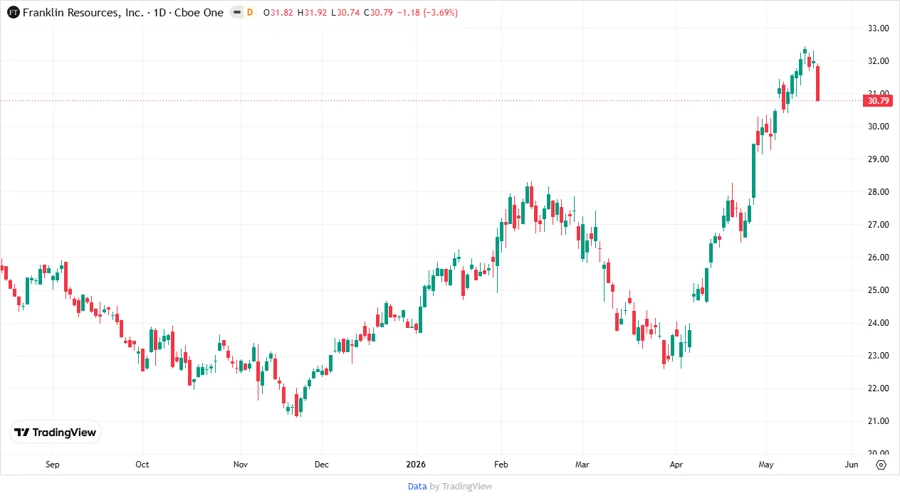
Price Development 💹
Dividend Scoring System ✅
| Criteria | Score | Score Bar |
|---|---|---|
| Dividend yield | 4 | |
| Dividend Stability | 5 | |
| Dividend growth | 3 | |
| Payout ratio | 3 | |
| Financial stability | 4 | |
| Dividend continuity | 5 | |
| Cashflow Coverage | 4 | |
| Balance Sheet Quality | 4 |
Total Score: 32/40
Rating 🌟
Franklin Resources displays a robust dividend proposition with consistent payouts and a reliable growth trend. While dividend growth is moderate, the high yield and stable financial metrics suggest a sound investment for income-focused portfolios.
Smart Data Insight
Master the Perfect Entry & Exit for this Stock
Don't leave your profits to chance. Historically, this stock follows specific seasonal patterns that institutional traders use to maximize returns.
- ✅ Identify the "Golden Buying Window"
- ✅ Avoid high-risk correction cycles
- ✅ Backtested data from the last 20+ years