March 07, 2026 a 07:31 am


BEN: Dividend Analysis - Franklin Resources, Inc.
Franklin Resources, Inc., a prominent player in the financial sector, boasts a well-established dividend history, underscored by a commendable 43 years of dividend payments. Coupled with a robust dividend yield of 4.95%, BEN remains an attractive choice for income-focused investors. Nonetheless, the payout ratio based on earnings per share exceeds 100%, which warrants a cautious approach.
📊 Overview
Franklin Resources, Inc. operates within the financial sector with a market-leading reputation. Its solid dividend profile includes a current dividend per share of USD 1.33 and a consistent dividend history spanning 43 years. Importantly, there has been no record of dividend cut or suspension in recent times.
| Metric | Value |
|---|---|
| Sector | Financial |
| Dividend Yield | 4.95% |
| Current Dividend Per Share | 1.33 USD |
| Dividend History | 43 Years |
| Last Cut or Suspension | None |
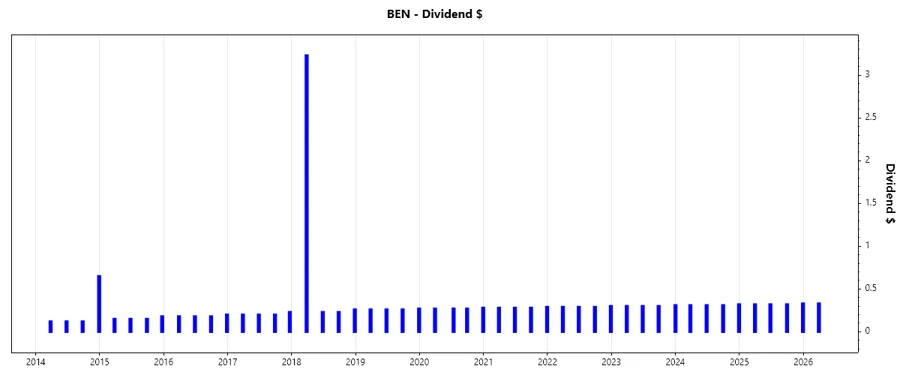
📉 Dividend History
The lengthy track record of dividend disbursement is testament to BEN's commitment to returning value to its shareholders. Such a history is crucial as it signals stability and reliability, making the company desirable for dividend-focused portfolios.
| Year | Dividend Per Share (USD) |
|---|---|
| 2026 | 0.33 |
| 2025 | 1.29 |
| 2024 | 1.56 |
| 2023 | 0.90 |
| 2022 | 1.17 |
📈 Dividend Growth
Assessing the dividend growth over a period is critical to gauge future expectations. It offers insight into the company's profitability and cash flow management prowess.
| Time | Growth |
|---|---|
| 3 years | 3.31% |
| 5 years | 3.43% |
The average dividend growth is 3.43% over 5 years. This shows moderate but steady dividend growth.
🗣️ Payout Ratio
The payout ratio is a critical measure of corporate sustainability in dividend payment. It compares the dividend paid against the earnings and cash flow, indicating the degree of financial strain it may place on the company.
| Key Figure | Ratio |
|---|---|
| EPS-based | 111.49% |
| Free Cash Flow-based | 79.22% |
The EPS-based payout ratio of 111.49% suggests dividends exceed earnings, a potential red flag. However, the FCF-based payout ratio stands at 79.22%, indicating moderate comfort in cash flow generation.
✅ Cashflow & Capital Efficiency
Cash flow is the lifeline for dividend payments, and efficiency metrics provide a compelling story about a company's effective capital use.
| Metric | 2023 | 2024 | 2025 |
|---|---|---|---|
| Free Cash Flow Yield | 7.81% | 7.74% | 7.66% |
| Earnings Yield | 7.32% | 4.53% | 4.41% |
| CAPEX to Operating Cash Flow | 13.66% | 18.23% | 14.49% |
| Stock-based Compensation to Revenue | 2.33% | 2.90% | 2.45% |
| Free Cash Flow/Operating Cash Flow Ratio | 85.61% | 81.77% | 85.51% |
BEN's cash flow and capital efficiency metrics indicate a well-managed financial structure with a decent balance of maintaining and growing shareholder value.
⚠️ Balance Sheet & Leverage Analysis
A solid balance sheet is crucial for maintaining financial health. Leverage ratios reveal potential risk from over-indebtedness and offer insights into the company’s financial sturdiness.
| Metric | 2023 | 2024 | 2025 |
|---|---|---|---|
| Debt-to-Equity | 0.99 | 1.05 | 1.10 |
| Debt-to-Assets | 0.39 | 0.40 | 0.41 |
| Debt-to-Capital | 0.50 | 0.51 | 0.52 |
| Net Debt to EBITDA | 3.85 | 6.31 | 6.88 |
| Current Ratio | 4.13 | 3.24 | 2.71 |
| Quick Ratio | 4.13 | 3.24 | 2.71 |
| Financial Leverage | 2.53 | 2.60 | 2.68 |
The analysis suggests that although leverage is present, the company maintains a comfortable position to meet its obligations due to higher current and quick ratios, indicating good liquidity.
✅ Fundamental Strength & Profitability
Profitability ratios are indicative of how effectively a company utilizes its resources to generate profit, while fundamental strengths highlight core operation efficiency.
| Metric | 2023 | 2024 | 2025 |
|---|---|---|---|
| Return on Equity | 7.41% | 3.72% | 4.35% |
| Return on Assets | 2.93% | 1.43% | 1.62% |
| Net Margin | 11.25% | 5.48% | 5.98% |
| EBIT Margin | 18.62% | 10.86% | 10.05% |
| EBITDA Margin | 24.30% | 16.22% | 16.12% |
| Gross Margin | 80.90% | 80.11% | 80.34% |
| R&D to Revenue | 0% | 0% | 0% |
Overall, BEN showcases a solid profitability framework, with commendable returns and margins. However, the lack of R&D could imply limited future innovation potential.
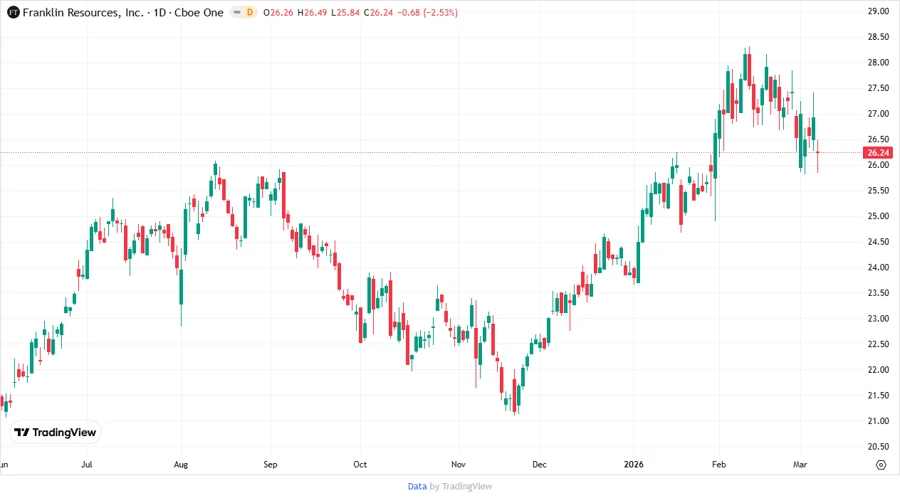
🔍 Price Development
🏅 Dividend Scoring System
| Criterion | Score | Description |
|---|---|---|
| Dividend Yield | 4 | |
| Dividend Stability | 5 | |
| Dividend Growth | 3 | |
| Payout Ratio | 2 | |
| Financial Stability | 3 | |
| Dividend Continuity | 5 | |
| Cashflow Coverage | 4 | |
| Balance Sheet Quality | 3 |
Overall Score: 29/40
📊 Rating
In summary, Franklin Resources, Inc. can be considered a reliable option for dividend portfolios thanks to its strong yield, consistent payments, and stable financial foundations. However, paying heed to the high EPS-based payout ratio is advisable. Moderate dividend growth coupled with solid cash flow positions BEN as a recommended buy for income-driven investors with a long-term perspective.
Smart Data Insight
Master the Perfect Entry & Exit for this Stock
Don't leave your profits to chance. Historically, this stock follows specific seasonal patterns that institutional traders use to maximize returns.
- ✅ Identify the "Golden Buying Window"
- ✅ Avoid high-risk correction cycles
- ✅ Backtested data from the last 20+ years