April 21, 2026 a 04:03 am

BDX: Trend and Support & Resistance Analysis - Becton, Dickinson and Company
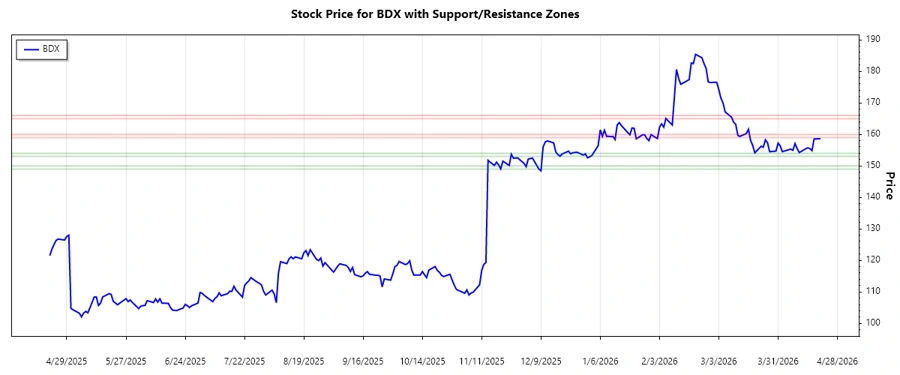
Becton, Dickinson and Company (BDX) is a prominent player in the medical supplies and technology sphere, showing resilience in market trends. Recent analysis indicates a nuanced positioning, reflecting both challenges and opportunities. Investors must pay attention to support and resistance zones to gauge future movements.
Trend Analysis
The trend analysis of BDX reveals significant insights into recent movements. Calculating the EMA20 and EMA50 from the closing prices helps in identifying the prevailing trend:
| Date | Close Price | Trend |
|---|---|---|
| 2026-04-20 | 158.64 | ▼ |
| 2026-04-17 | 158.54 | ▼ |
| 2026-04-16 | 154.82 | ▼ |
| 2026-04-15 | 155.52 | ▼ |
| 2026-04-14 | 155.73 | ▼ |
| 2026-04-13 | 155.43 | ▼ |
| 2026-04-10 | 154.22 | ▼ |
The continuous downward pointing arrows indicate the presence of a persistent downtrend, as EMA20 < EMA50. This trend suggests caution for potential investors as the stock has been in a declining phase.
Support- and Resistance
Identifying key support and resistance levels is crucial for understanding BDX's market positioning.
| Zone | From | To |
|---|---|---|
| Support Zone 1 | 153.00 | 154.00 |
| Support Zone 2 | 149.00 | 150.00 |
| Resistance Zone 1 | 159.00 | 160.00 |
| Resistance Zone 2 | 165.00 | 166.00 |
Currently, the stock is trading between support zones, indicating potential stabilization but also vulnerability to further downward movements. Traders must watch for breakouts or breakdowns from these levels.
Conclusion
The stock BDX is navigating through a downtrend, evidenced by the EMA metrics and price movements. While support levels offer potential cushions, resistance zones pose challenges to recovery. Market participants should be vigilant as BDX responds to sector dynamics and broader market conditions. Opportunities lie in strategic entry points within support zones, while risks encompass potential volatility and further declines. Fundamental analysis in synergy with technical insights can provide a comprehensive investment strategy.