December 14, 2025 a 11:44 am
BDX: Fibonacci Analysis - Becton, Dickinson and Company
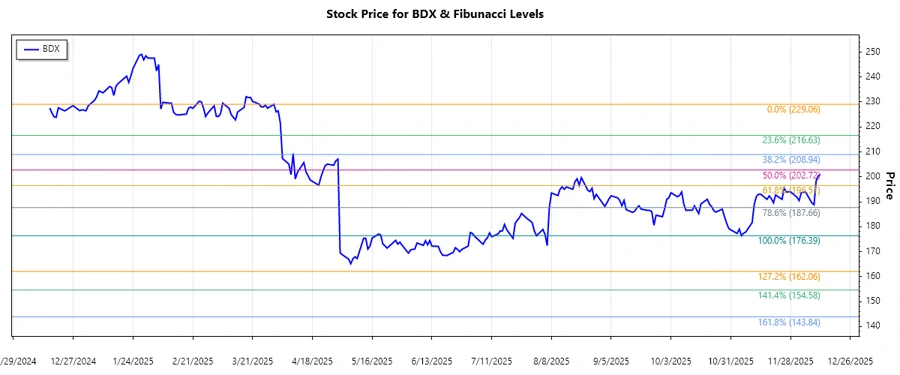
Becton, Dickinson and Company (BDX) is a notable player in the medical supplies and diagnostics industry, experiencing various market fluctuations over recent months. The technical analysis for BDX shows that the stock has recently experienced a dominant downward trend with a series of lower highs and lows. Considering the broader industry landscape, BDX's price movements largely reflect sector trends and competitive market conditions which may present both risks and opportunities for investors.
Fibonacci Analysis
| Attribute | Details |
|---|---|
| Trend Type | Downward |
| Start Date | 2025-04-01 |
| End Date | 2025-12-12 |
| High Point | $229.06 on 2025-03-31 |
| Low Point | $176.39 on 2025-11-05 |
| Current Price | $200.89 |
Fibonacci Levels
| Level | Price |
|---|---|
| 0.236 | $190.43 |
| 0.382 | $196.27 |
| 0.5 | $202.73 |
| 0.618 | $209.19 |
| 0.786 | $217.91 |
The current BDX stock price of $200.89 is within the 0.382 Fibonacci retracement level range, indicating a potential area of support. The technical outlook suggests that if the stock holds above this level, it could signal a reversal or stabilization. However, falling below could indicate continued bearish sentiment.
Conclusion
In summary, the Becton, Dickinson and Company (BDX) stock is exhibiting characteristics of a dominant downtrend, reflected in lower highs and lows within the past months. The Fibonacci analysis suggests a potential support around the $196.27 level. Investors should consider the prevailing market conditions and sector dynamics alongside this technical insight, as volatility in the healthcare sector could impact price stability. It's an opportune moment to observe any changes in price action around the Fibonacci levels to assess continuation or reversal signals. Understanding these dynamics is crucial for strategic investment decisions, balancing potential gains against inherent risks.