September 04, 2025 a 05:15 am
BDX: Fibonacci Analysis - Becton, Dickinson and Company
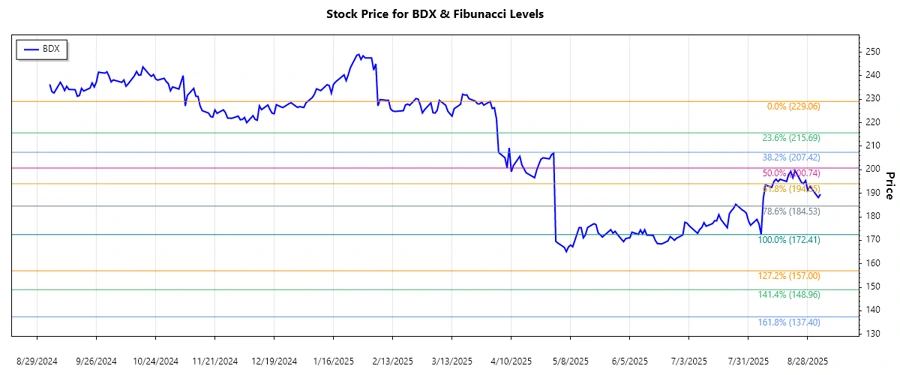
Becton, Dickinson and Company (BDX) has shown a noteworthy transition over recent months. The stock experienced a clear downward trend from its high in April 2025. This medical technology company, renowned for its diverse portfolio ranging from medical devices to diagnostic systems, faced price adjustments amidst market shifts. As the global healthcare landscape evolves, BDX remains a significant player, yet market fluctuations offer both opportunities and cautions for investors.
Fibonacci Analysis
| Detail | Information |
|---|---|
| Trend Period | April 1, 2025 - September 3, 2025 |
| High Point | $229.06 on April 1, 2025 |
| Low Point | $172.41 on August 6, 2025 |
| Fibonacci Levels |
|
| Current Price | August 29, 2025 - $192.98 |
| Retracement Zone | 0.382 |
| Technical Interpretation | The current price is within the 0.382 retracement level, suggesting this area could potentially act as a support level. However, a sustained breakthrough below this could indicate further bearish momentum. |
Conclusion
Becton, Dickinson and Company’s recent price movement reflects broader market dynamics amidst a downward trend from earlier highs. The current retracement levels suggest potential support, though the bearish trend could continue if support levels break. For stakeholders, the volatility represents both risks and buying opportunities, contingent on broader market movements and company resilience. Analysts should closely monitor upcoming earnings and sector developments to gauge potential reversals or continuations in trend.