February 23, 2026 a 07:31 am

BDX: Dividend Analysis - Becton, Dickinson and Company
Becton, Dickinson and Company (BDX) is a prestigious player with a robust dividend history spanning over 45 years, exemplifying stability and that impressive consistency. The company's current dividend yield of 1.89% reflects a moderate distribution strategy aimed at sustainable long-term investor returns. With no recent dividend cuts or suspensions, BDX maintains a strong commitment to reward its shareholders steadily.
Overview 📊
BDX is a significant entity in the sector characterized by its consistent dividend strategy. With a dividend yield of 1.89%, BDX offers moderate returns through dividends. A noteworthy dividend history spanning 45 years without recent cuts underscores reliability.
| Metric | Value |
|---|---|
| Sector | Health Care |
| Dividend yield | 1.89% |
| Current dividend per share | 4.17 USD |
| Dividend history | 45 years |
| Last cut or suspension | None |
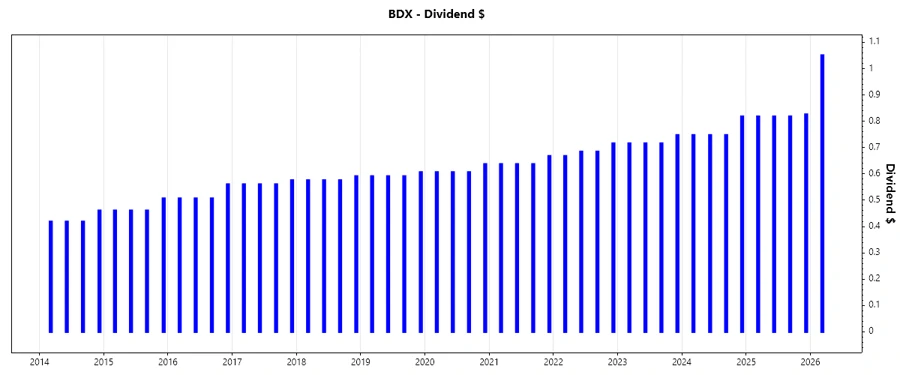
Dividend History 🗣️
Over the past 45 years, BDX has built a reliable track record with its dividend policy, creating significant interest for long-term investors looking for stability. Understanding the history aids in assessing the company’s commitment to shareholder returns.
| Year | Dividend Per Share (USD) |
|---|---|
| 2026 | 1.05 |
| 2025 | 3.278 |
| 2024 | 3.058 |
| 2023 | 2.893 |
| 2022 | 2.751 |
Dividend Growth 📈
BDX showcases moderate dividend growth with a three-year growth rate of 6.02% and a five-year growth rate of 5.96%. This continuous increase reflects its focus on sustainable expansion and incremental returns to investors.
| Time | Growth |
|---|---|
| 3 years | 6.02% |
| 5 years | 5.96% |
The average dividend growth is 5.96% over 5 years. This shows moderate but steady dividend growth.
Payout Ratio ⚠️
The payout ratios, which are essential in assessing a company's financial health, indicate that BDX channels a significant portion of its earnings and free cash flow into dividends. With an EPS payout ratio of 67.7% and a FCF payout ratio of 57.5%, these metrics suggest a balanced approach towards maintaining enough reserves while rewarding shareholders.
| Key figure | Ratio |
|---|---|
| EPS-based | 67.7% |
| Free cash flow-based | 57.5% |
The company's EPS payout ratio of 67.7% and FCF payout ratio of 57.5% are indicative of a sustainable yet generous dividend payment policy.
Cashflow & Capital Efficiency 💹
BDX maintains robust cash flow metrics, critical to sustaining its dividend policy and supporting operational investments. Key indicators of cash flow efficiency reveal a prudent allocation that supports operational expansion and shareholder returns.
| Metric | 2025 | 2024 | 2023 |
|---|---|---|---|
| Free Cash Flow Yield | 8.05% | 7.11% | 4.62% |
| Earnings Yield | 5.06% | 3.95% | 3.24% |
| CAPEX to Operating Cash Flow | 22.2% | 19.1% | 29.2% |
| Stock-based Compensation to Revenue | 1.18% | 1.22% | 1.34% |
| Free Cash Flow / Operating Cash Flow Ratio | 77.8% | 80.9% | 70.8% |
The impressive cash flow generation capability and efficient capital allocation corroborate BDX’s strategies promoting both operational growth and investor remuneration.
Balance Sheet & Leverage Analysis 📉
BDX's balance sheet metrics reflect strategic leverage management, underpinning its stability and operational scale. The company's debt ratios showcase responsible fiscal practices supporting its capital strategies and liquidity management.
| Metric | 2025 | 2024 | 2023 |
|---|---|---|---|
| Debt-to-Equity | 0.755 | 0.834 | 0.652 |
| Debt-to-Assets | 0.347 | 0.377 | 0.319 |
| Debt-to-Capital | 0.430 | 0.455 | 0.395 |
| Net Debt to EBITDA | 3.70 | 4.09 | 3.50 |
| Current Ratio | 1.113 | 1.169 | 1.306 |
| Quick Ratio | 0.645 | 0.740 | 0.814 |
| Financial Leverage | 2.179 | 2.213 | 2.046 |
The analysis reveals prudent leverage and liquidity management enabling sustainable debt coverage and a buffer for adversity.
Fundamental Strength & Profitability ✅
Assessing BDX's profitability and operational efficiency indicates a solid foundation, essential for sustained shareholder value. Its profit margins and return metrics affirm effective cost control and strategic resource allocation.
| Metric | 2025 | 2024 | 2023 |
|---|---|---|---|
| Return on Equity | 6.61% | 6.59% | 5.75% |
| Return on Assets | 3.03% | 2.98% | 2.81% |
| Margins: Net | 7.68% | 8.45% | 7.66% |
| Margins: EBIT | 11.42% | 12.55% | 10.91% |
| Margins: EBITDA | 22.70% | 23.88% | 22.72% |
| Margins: Gross | 45.44% | 45.22% | 42.17% |
| R&D to Revenue | 5.79% | 5.90% | 6.39% |
BDX's profitability metrics showcase a well-managed operation sustaining growth and delivering consistent returns to equity holders.
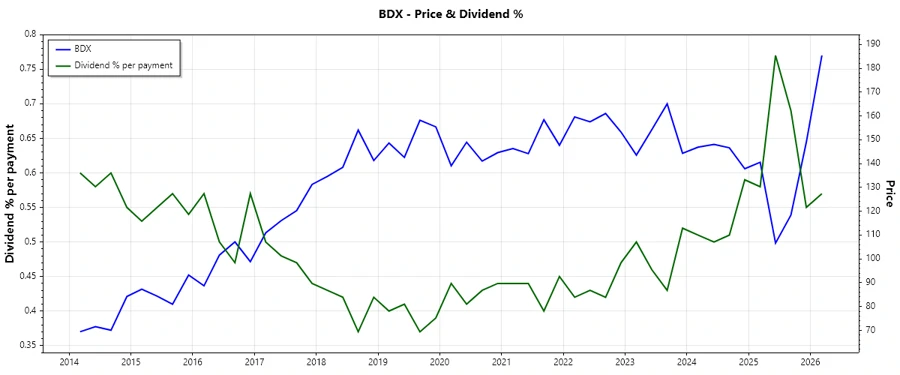
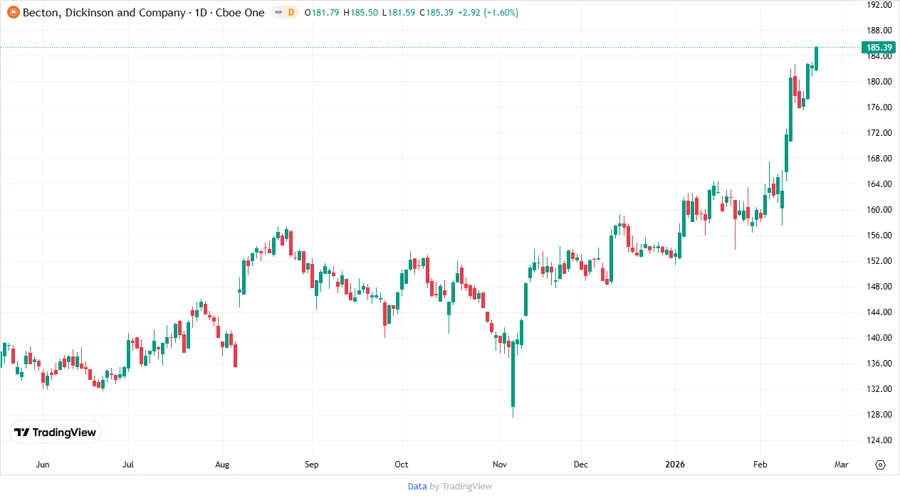
Price Development 📈
Dividend Scoring System 🌟
| Criteria | Score | Score Bar |
|---|---|---|
| Dividend Yield | 3 | |
| Dividend Stability | 5 | |
| Dividend Growth | 4 | |
| Payout Ratio | 4 | |
| Financial Stability | 4 | |
| Dividend Continuity | 5 | |
| Cashflow Coverage | 4 | |
| Balance Sheet Quality | 4 |
Overall Score: 33/40
Rating 🌟
Becton, Dickinson and Company demonstrates solid fundamentals and a commitment to consistent dividend payouts, making it a reliable choice for dividend-seeking investors. With a comprehensive dividend history and prudent management practices, BDX is highly recommended for investors pursuing stability and incremental growth in their portfolios.
Smart Data Insight
Master the Perfect Entry & Exit for this Stock
Don't leave your profits to chance. Historically, this stock follows specific seasonal patterns that institutional traders use to maximize returns.
- ✅ Identify the "Golden Buying Window"
- ✅ Avoid high-risk correction cycles
- ✅ Backtested data from the last 20+ years