August 08, 2025 a 03:31 pm


BDX: Dividend Analysis - Becton, Dickinson and Company
Becton, Dickinson and Company presents a strong dividend profile with a current yield of 2.22%, supported by a solid history of 44 years of dividend payments. The company has shown a capability to maintain stable distributions, exhibiting no cuts or suspensions in recent years. Despite moderate growth rates in dividends over the last 3 and 5 years, BDX's consistent payouts make it an appealing option for investors seeking dependable returns.
📊 Overview
Becton, Dickinson and Company operates in the diversified healthcare sector and is recognized for its reliable dividend payments. The company has been paying dividends for 44 consecutive years and is known for its commitment to returning capital to shareholders.
| Key Metric | Detail |
|---|---|
| Sector | Healthcare |
| Dividend Yield | 2.22% |
| Current Dividend Per Share | 3.80 USD |
| Dividend History | 44 years |
| Last Cut or Suspension | None |
🗣️ Dividend History
The dividend history is often a measure of a company's financial health and its commitment to share capital return. With 44 years of uninterrupted payments, BDX illustrates a high level of stability and credibility in rewarding its shareholders.
| Year | Dividend Per Share (USD) |
|---|---|
| 2025 | 3.12 |
| 2024 | 3.89 |
| 2023 | 3.68 |
| 2022 | 3.50 |
| 2021 | 3.28 |
📈 Dividend Growth
The dividend growth rate is an essential indicator of the company's future dividend policy sustainability and growth prospects. BDX's growth over the past 5 years has been steady, reflecting the company's prudent management and stable cash flow generation.
| Time | Growth |
|---|---|
| 3 years | 5.87% |
| 5 years | 5.16% |
The average dividend growth is 5.16% over 5 years. This shows moderate but steady dividend growth.
✅ Payout Ratio
The payout ratio provides insight into the sustainability of a company's dividend. BDX's EPS-based payout ratio of 69.95% indicates a balanced approach towards growth and dividend distribution, while the Free Cash Flow-based payout of 40.28% suggests ample liquidity for future dividends.
| Key figure ratio | Value |
|---|---|
| EPS-based | 69.95% |
| Free cash flow-based | 40.28% |
The EPS payout ratio of 69.95% suggests a strong commitment to maintaining and slightly increasing dividends, while the FCF ratio shows room for flexibility and growth.
📊 Cashflow & Capital Efficiency
Analyzing cash flow metrics and capital efficiency is crucial to understanding a company's financial flexibility and operational effectiveness. The Free Cash Flow Yield indicates return levels on available cash resources, which are vital for sustaining dividend payments.
| Year | Free Cash Flow Yield | Earnings Yield | CAPEX to Operating Cash Flow | Stock-based Compensation to Revenue | Free Cash Flow / Operating Cash Flow Ratio |
|---|---|---|---|---|---|
| 2024 | 4.40% | 2.44% | 19.09% | 1.22% | 80.88% |
| 2023 | 2.86% | 2.01% | 29.24% | 1.34% | 70.76% |
| 2022 | 2.61% | 2.80% | 36.95% | 1.23% | 63.05% |
The above measures reflect BDX's ability to generate cash and manage capital effectively, which supports its dividend stability and potential future growth.
⚠️ Balance Sheet & Leverage Analysis
A strong balance sheet is fundamental to sustaining dividend payments, indicated by leverage ratios. It reflects a company's solvency and ability to meet its long-term obligations.
| Year | Debt-to-Equity | Debt-to-Assets | Debt-to-Capital | Net Debt to EBITDA | Current Ratio | Quick Ratio | Financial Leverage |
|---|---|---|---|---|---|---|---|
| 2024 | 0.81 | 0.37 | 0.45 | 3.98 | 1.17 | 0.74 | 2.21 |
| 2023 | 0.62 | 0.30 | 0.38 | 3.38 | 1.31 | 0.81 | 2.05 |
| 2022 | 0.64 | 0.30 | 0.39 | 3.51 | 1.04 | 0.63 | 2.09 |
The data reflects a relatively stable balance sheet with manageable leverage levels that are supportive of ongoing dividend payments and financial stability.
📉 Fundamental Strength & Profitability
Assessing profitability and fundamental strength provides insights into the economic value creation of the company. It includes evaluating resource efficiency and profitability margins.
| Year | Return on Equity | Return on Assets | ROIC | Net Margin | EBIT Margin | EBITDA Margin | Gross Margin | R&D to Revenue |
|---|---|---|---|---|---|---|---|---|
| 2024 | 6.59% | 2.98% | 4.03% | 8.45% | 12.55% | 23.88% | 45.22% | 5.89% |
| 2023 | 5.75% | 2.81% | 4.11% | 7.66% | 10.91% | 22.07% | 42.17% | 6.39% |
| 2022 | 7.04% | 3.36% | 4.42% | 9.43% | 11.58% | 22.72% | 44.92% | 6.66% |
BDX demonstrates solid profitability and sound fundamental strength, underpinned by consistent profit margins and reinvestment in research and development, supporting long-term growth and dividend sustainability.
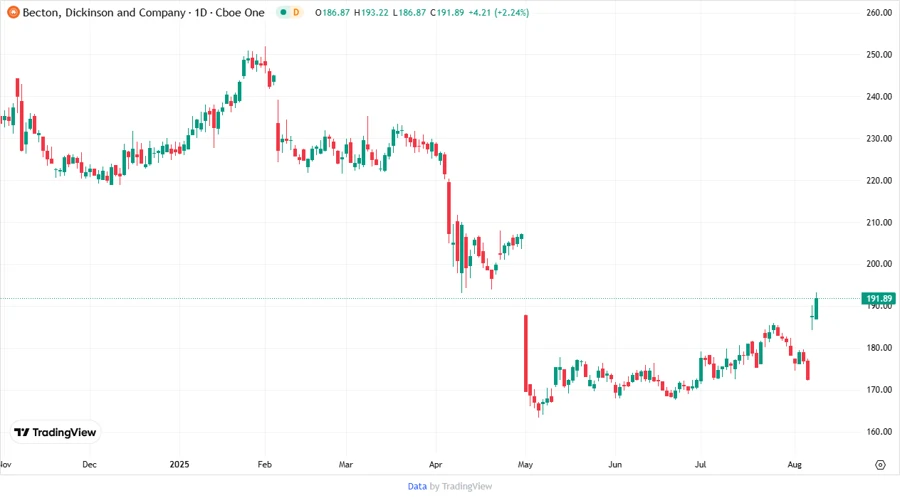
Price Development
🔍 Dividend Scoring System
| Criteria | Description | Score |
|---|---|---|
| Dividend yield | Consistent yield at competitive rate | 3/5 |
| Dividend Stability | No cuts over 44 years | 5/5 |
| Dividend growth | Moderate but steady growth | 3/5 |
| Payout ratio | EPS payout within healthy range | 4/5 |
| Financial stability | Strong balance sheet metrics | 4/5 |
| Dividend continuity | Sustained payout without interruption | 5/5 |
| Cashflow Coverage | Sufficient cash flow to cover payouts | 4/5 |
| Balance Sheet Quality | Balanced leverage ratios | 3/5 |
Total Score: 31/40
🎯 Rating
Overall, Becton, Dickinson and Company offers an attractive dividend profile for income-focused investors. The continuity and stability of its payouts, along with a commitment to moderate growth, render BDX an appealing selection for a balanced investment portfolio prioritizing reliable dividend income over aggressive yield. As such, BDX maintains a commendable position and is recommended as a "Buy" for dividend-seeking investors.
Smart Data Insight
Master the Perfect Entry & Exit for this Stock
Don't leave your profits to chance. Historically, this stock follows specific seasonal patterns that institutional traders use to maximize returns.
- ✅ Identify the "Golden Buying Window"
- ✅ Avoid high-risk correction cycles
- ✅ Backtested data from the last 20+ years