March 13, 2026 a 02:03 pm

BBY: Trend and Support & Resistance Analysis - Best Buy Co., Inc.
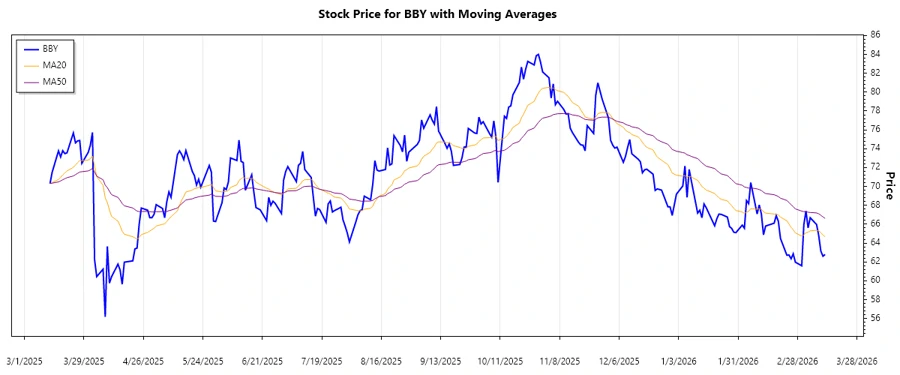
Best Buy Co., Inc. operates as a retailer of technology products in the United States and Canada. Recent trading patterns indicate a consolidation phase following a prior downtrend. Investors should observe potential zones for price breakout or breakdowns amidst fluctuating market conditions. The analysis below uses EMA indicators and defines critical support and resistance zones.
Trend Analysis
The calculated Exponential Moving Averages (EMA) for the 20-day and 50-day periods indicate the current prevailing market trend for BBY's stock. Based on recent prices, we observe a transition phase from a prior downtrend.
| Date | Close Price | Trend |
|---|---|---|
| 2026-03-13 | 62.79 | ▼ |
| 2026-03-12 | 62.60 | ▼ |
| 2026-03-11 | 63.15 | ▲ |
| 2026-03-10 | 64.80 | ▲ |
| 2026-03-09 | 65.96 | ▲ |
| 2026-03-06 | 66.68 | ▲ |
| 2026-03-05 | 65.60 | ▼ |
Conclusively, there is a slight bullish indicator in recent days, represented by rising EMA20 nearing convergence with EMA50.
Support- and Resistance
Key support and resistance zones are identified by analyzing the historical price action.
| Zone Type | From | To |
|---|---|---|
| Support 1 | 61.50 | 62.50 |
| Support 2 | 63.00 | 64.00 |
| Resistance 1 | 66.50 | 67.50 |
| Resistance 2 | 68.00 | 69.00 |
The current price is near the first resistance zone, suggesting potential challenges in sustaining upward momentum without additional buying pressure.
Conclusion
The current trading pattern of Best Buy Co., Inc. reveals opportunities and risks. The recent price recovery suggests potential for continued upward movement should resistance levels be breached. Conversely, descending back to the support zones indicates risk for further downsides. Investors should remain alert to market news and earnings that could impact the trajectory. Technically, there's a shift towards stabilization with the potential for breakout based on momentum and external market factors.