February 04, 2026 a 09:03 am
BBY: Trend and Support & Resistance Analysis - Best Buy Co., Inc.
Best Buy Co., Inc. operates as a retailer of technology products in the U.S. and Canada. With a diverse range of computing, mobile, and appliance products, they also provide a variety of services including consultation and installations under several brands. As the retail sector faces continuously evolving consumer electronics trends, BBY's stock reflects the overall volatility and dynamics of this industry.
Trend Analysis
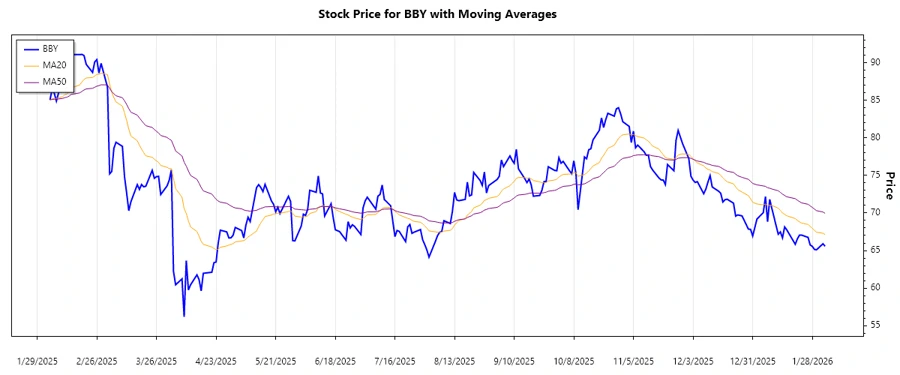
From the historical data, Best Buy's stock (BBY) has exhibited notable movements within the analyzed months. A closer look at the calculated Exponential Moving Averages (EMAs) for the 20-day and 50-day periods indicates a prevalent downward trend over the recent weeks.
| Date | Close Price | Trend |
|---|---|---|
| 2026-02-03 | $65.57 | ▼ |
| 2026-02-02 | $65.90 | ▼ |
| 2026-01-30 | $65.10 | ▼ |
| 2026-01-29 | $65.15 | ▼ |
| 2026-01-28 | $65.56 | ▼ |
| 2026-01-27 | $65.74 | ▼ |
| 2026-01-26 | $66.75 | ▼ |
The analysis using EMA20 and EMA50 signifies a persistent bearish sentiment as the EMA20 line remains consistently below the EMA50.
Support and Resistance
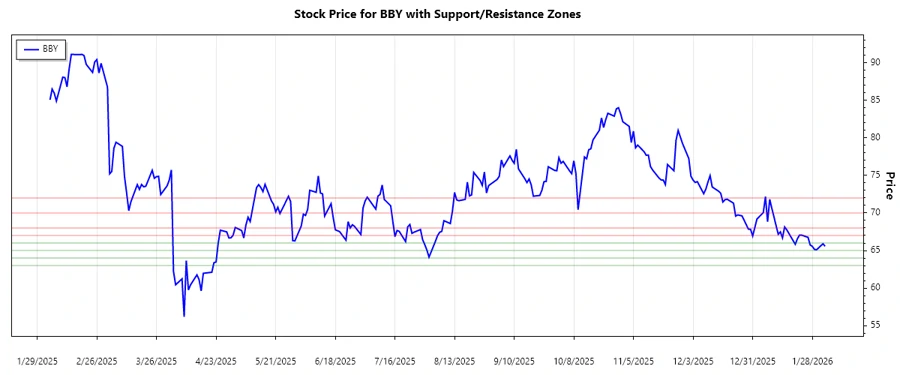
Key levels of support and resistance for BBY have been identified based on historical closing prices.
| Support/Resistance | Price Range |
|---|---|
| Resistance | $70.00 - $72.00 ▲ |
| Resistance | $67.00 - $68.00 ▲ |
| Support | $65.00 - $66.00 ▼ |
| Support | $63.00 - $64.00 ▼ |
Given the current price of the stock hovering around $65.57, the stock is sitting just above a strong support zone. This position often implies a potential bounce back if the support holds.
Conclusion
With Best Buy Co., Inc.'s current downward trend and proximity to crucial support zones, the stock shows signs of potential stabilization if the support holds. However, breaking below these levels could accelerate the downward momentum, posing a risk for potential investors. Conversely, if these support levels hold, a technical rebound may be anticipated. Evaluating these factors can aid in making informed investment decisions regarding BBY stock.