
July 05, 2026 a 06:00 pm

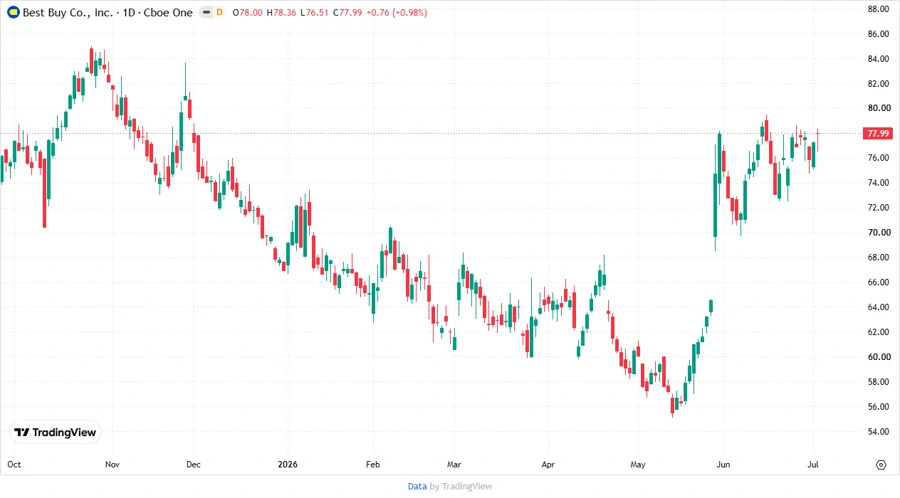
BBY: Fundamental Ratio Analysis - Best Buy Co., Inc.
Best Buy Co., Inc. presents a stable opportunity within the specialty retail industry, balancing innovation and tradition. Comprehensively covering domestic and international markets, it offers diverse tech solutions and services. With a variable market presence and a recent steady performance, scrutinizing its fundamentals and analyst sentiments is vital for potential stakeholders.
Fundamentals Rating
Best Buy enjoys a solid overall score with room for improvement, particularly in debt management.
| Category | Score | Visualization |
|---|---|---|
| Overall | 3 | |
| Discounted Cash Flow | 3 | |
| Return on Equity | 5 | |
| Return on Assets | 4 | |
| Debt to Equity | 1 | |
| Price to Earnings | 4 | |
| Price to Book | 2 |
Historical Rating
The historical performance analysis indicates consistency in several financial metrics.
| Date | Overall | DCF | ROE | ROA | Debt/Equity | P/E | P/B |
|---|---|---|---|---|---|---|---|
| 2026-07-02 | 3 | 3 | 5 | 4 | 1 | 4 | 2 |
| Previous Date | 0 | 3 | 5 | 4 | 1 | 4 | 2 |
Analyst Price Targets
Analysts have set varied price targets, reflecting diverse expectations.
| High | Low | Median | Consensus |
|---|---|---|---|
| $90 | $60 | $77 | $76.4 |
Analyst Sentiment
The analyst sentiment is generally cautious, with a majority suggesting a hold position.
| Recommendation | Number | Visualization |
|---|---|---|
| Strong Buy | 0 | |
| Buy | 14 | |
| Hold | 22 | |
| Sell | 5 | |
| Strong Sell | 0 |
Conclusion
Best Buy Co., Inc., due to its diverse product and service offerings, presents potential opportunities despite facing industry challenges. With a balanced technological portfolio and strong returns on equity and assets, future growth is promising if debt issues are managed. Analyst sentiments suggest careful observation, hinting at holding rather than aggressively purchasing. Investors should heed both the upside potential and the inherent risks within the dynamic retail environment. The company's ability to innovate and adapt will be critical in maintaining and enhancing shareholder value.
Smart Data Insight
Master the Perfect Entry & Exit for this Stock
Don't leave your profits to chance. Historically, this stock follows specific seasonal patterns that institutional traders use to maximize returns.
- ✅ Identify the "Golden Buying Window"
- ✅ Avoid high-risk correction cycles
- ✅ Backtested data from the last 20+ years