April 13, 2026 a 07:43 pm
BBY: Fundamental Ratio Analysis - Best Buy Co., Inc.
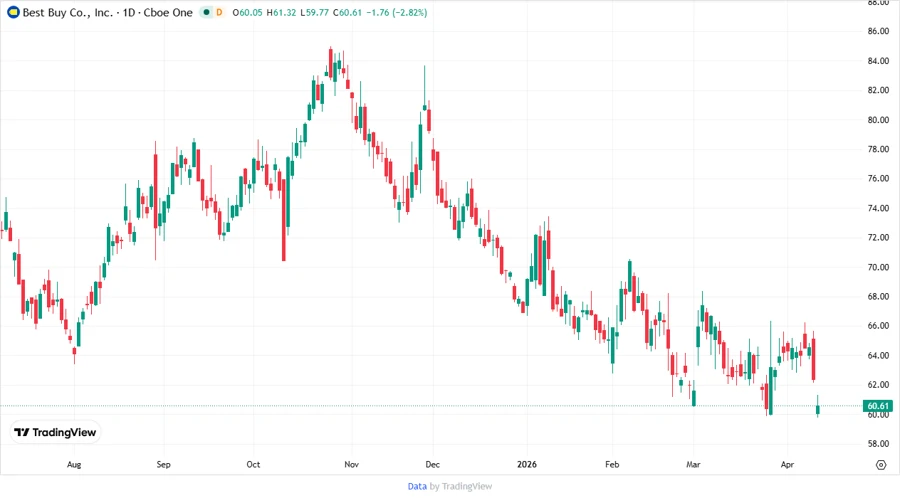
The stock of Best Buy Co., Inc., represented by the ticker BBY, is currently positioned in a competitive consumer cyclicals market. Best Buy operates extensively in the U.S. and Canadian markets, showcasing a diverse range of electronic and home-related products. With a multitude of services available, including technical support and repair services, the company continues to adapt to evolving consumer needs.
Fundamental Rating
Best Buy presents a solid fundamental standing, highlighted by strong return metrics and a reasonable P/E valuation.
| Category | Rating | Score |
|---|---|---|
| Discounted Cash Flow | 3 | |
| Return on Equity | 5 | |
| Return on Assets | 5 | |
| Debt to Equity | 1 | |
| Price to Earnings | 4 | |
| Price to Book | 2 |
Historical Rating
The historical evaluation reflects stable returns with consistent scoring across pivotal metrics.
| Date | Overall | DCF | ROE | ROA | D/E | P/E | P/B |
|---|---|---|---|---|---|---|---|
| 2026-04-13 | 4 | 3 | 5 | 5 | 1 | 4 | 2 |
| Previous | 0 | 3 | 5 | 5 | 1 | 4 | 2 |
Analyst Price Targets
Analysts' opinions show a median target with some upside potential, albeit with mixed sentiments.
| High | Low | Median | Consensus |
|---|---|---|---|
| $96 | $66 | $75.5 | $75.75 |
Analyst Sentiment
The consensus indicates a predominance of 'Hold' recommendations, reflecting caution in the market.
| Recommendation | Count | Percentage |
|---|---|---|
| Strong Buy | 0 | |
| Buy | 15 | |
| Hold | 21 | |
| Sell | 5 | |
| Strong Sell | 0 |
Conclusion
Best Buy Co., Inc. stands as a key player in the technology retail sector, with robust fundamentals and stable returns. While the stock has shown consistent past performance, the mixed analyst ratings and 'Hold' consensus suggest cautious optimism. Strategic growth opportunities and risks, such as market competition and technological advancements, should be carefully weighed by potential investors. The company’s diverse product range and service offerings remain its strengths in maintaining market relevance.
Smart Data Insight
Master the Perfect Entry & Exit for this Stock
Don't leave your profits to chance. Historically, this stock follows specific seasonal patterns that institutional traders use to maximize returns.
- ✅ Identify the "Golden Buying Window"
- ✅ Avoid high-risk correction cycles
- ✅ Backtested data from the last 20+ years