September 23, 2025 a 06:45 am
BBY: Fibonacci Analysis - Best Buy Co., Inc.
Best Buy Co., Inc. has experienced recent fluctuations reflecting the broader market conditions. The company remains a leader in retail technology, yet is vulnerable to economic shifts. Careful stock monitoring is recommended, especially with identified retracement levels, which may signal future price movements.
Fibonacci Analysis
| Attribute | Value |
|---|---|
| Start Date | 2024-09-30 |
| End Date | 2025-09-22 |
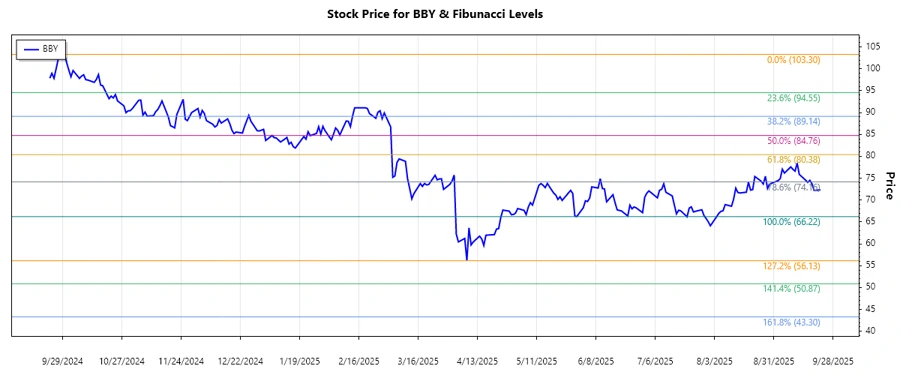
| High (Price/Date) | $103.30 / 2024-09-30 |
| Low (Price/Date) | $66.22 / 2025-08-04 |
| Fibonacci Levels (Price) |
0.236: $75.77 0.382: $80.78 0.500: $84.76 0.618: $88.74 0.786: $94.18 |
| Current Retracement Zone | 0.236 |
| Technical Interpretation | The stock is in the early retracement phase. This may act as short-term support, but watch for potential downward pressure if it fails to hold. |
Conclusion
The current trend for Best Buy Co., Inc. suggests a potential reversal from recent lows, signaled by the Fibonacci retracement levels. Investors should watch for support at the early retracement zone, though further declines could prompt increased caution. The company's established market position remains a strength, but inflationary pressures and market volatility pose considerable risks. Continued monitoring of market conditions and company's earnings reports is advisable to assess future stock performance.
Smart Data Insight
Master the Perfect Entry & Exit for this Stock
Don't leave your profits to chance. Historically, this stock follows specific seasonal patterns that institutional traders use to maximize returns.
- ✅ Identify the "Golden Buying Window"
- ✅ Avoid high-risk correction cycles
- ✅ Backtested data from the last 20+ years