June 12, 2025 a 06:44 am

BBY: Fibonacci Analysis - Best Buy Co., Inc.
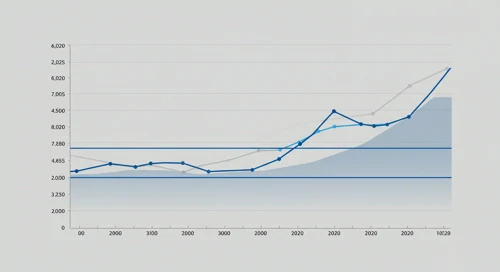
Best Buy Co., Inc., a leading retailer of technology products, has experienced dynamic fluctuations in its stock prices over recent months. The company's extensive range of consumer electronics, appliances, and digital services positions it well to capitalize on ongoing tech demand in North America. However, economic challenges and competitive pressures may impact its growth trajectory. A thorough technical analysis reveals critical insights into the stock's potential movement in the coming months.
Fibonacci Analysis
| Description | Details |
|---|---|
| Trend Start Date | 2024-06-12 |
| Trend End Date | 2025-06-11 |
| High Point | $103.30 on 2024-09-30 |
| Low Point | $56.17 on 2025-04-08 |
| Fibonacci Level | Price |
|---|---|
| 0.236 | $69.92 |
| 0.382 | $76.06 |
| 0.5 | $79.73 |
| 0.618 | $83.39 |
| 0.786 | $89.26 |
As of the most recent trading session, the current price of Best Buy Co., Inc. is $72.65. This places the stock within the 0.236 Fibonacci retracement level. Technically, this suggests a potential area of support, where the price might experience buying interest and potentially reverse upwards.
Conclusion
Best Buy Co., Inc. exhibits a mixed outlook with notable opportunities and risks. The current price's proximity to the 0.236 retracement level could imply a supportive base for potential upward movement. However, external economic factors and retail competition could pose challenges. Analysts should closely monitor these Fibonacci levels as they may indicate key support and resistance zones relevant to decision-making. In summary, while the stock might present a buying opportunity at current levels, cautious observation is advised given market volatility.
Smart Data Insight
Master the Perfect Entry & Exit for this Stock
Don't leave your profits to chance. Historically, this stock follows specific seasonal patterns that institutional traders use to maximize returns.
- ✅ Identify the "Golden Buying Window"
- ✅ Avoid high-risk correction cycles
- ✅ Backtested data from the last 20+ years