February 26, 2026 a 07:46 am


BBY: Dividend Analysis - Best Buy Co., Inc.
Best Buy Co., Inc. has consistently impressed with a strong dividend profile. With a solid dividend yield and a long history of payouts, it stands out among its peers in the retail industry. However, investors should take note of certain financial metrics which suggest areas of cautious optimism. Here's a detailed analysis of Best Buy's dividend performance and financial health.
📊 Overview
Best Buy operates within the retail sector, boasting a dividend yield of 5.23%, which is attractive in today's market. The company, a stalwart in dividends with a 23-year history of payments, last cut or suspended its payout in 2017. This positions Best Buy as a potential investment for income-focused portfolios.
| Metric | Detail |
|---|---|
| Sector | Retail |
| Dividend yield | 5.23 % |
| Current dividend per share | 3.75 USD |
| Dividend history | 23 years |
| Last cut or suspension | 2017 |
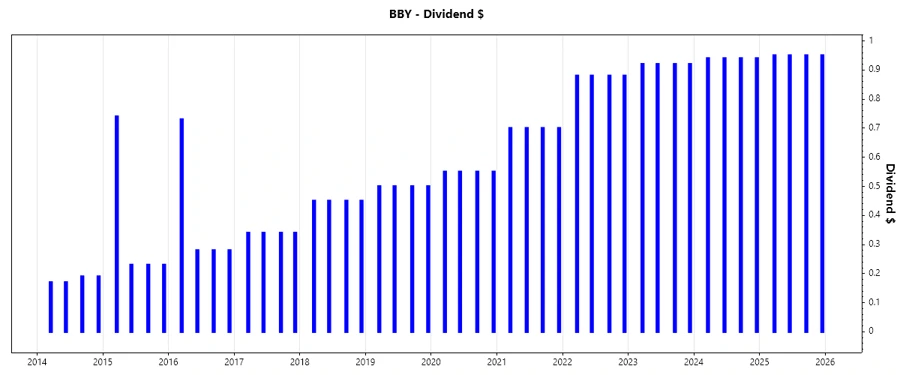
📉 Dividend History
Best Buy has demonstrated a history of stable and increasing dividends, reflecting its commitment to shareholder returns. This stability is crucial for investors looking for reliable income streams, mitigating risks in more volatile sectors.
| Year | Dividend Per Share (USD) |
|---|---|
| 2025 | 3.80 |
| 2024 | 3.76 |
| 2023 | 3.68 |
| 2022 | 3.52 |
| 2021 | 2.80 |
📈 Dividend Growth
The dividends have exhibited growth over the years, marking an average increase. This incremental growth is an indication of stable financial conditions within Best Buy.
| Time | Growth |
|---|---|
| 3 years | 2.58 % |
| 5 years | 11.55 % |
The average dividend growth is 11.55% over 5 years. This shows moderate but steady dividend growth.
🗣️ Payout Ratio
The payout ratios are vital for assessing the sustainability of dividend payments. A high payout ratio might indicate that a company is overly reliant on its earnings to maintain dividends.
| Key figure | Ratio |
|---|---|
| EPS-based | 122.50 % |
| Free cash flow-based | 52.04 % |
An EPS payout ratio of 122.50% suggests caution as it exceeds 100%, indicating dividends exceed net income. However, the FCF payout at 52.04% suggests some coverage through cash flow, though slightly above ideal levels.
✅ Cashflow & Capital Efficiency
Analyzing cash flow and capital efficiency helps to reveal the company's ability to generate cash and manage its capital expenditures effectively, ensuring long-term sustainability. The following data illustrates Best Buy's recent financial metrics, highlighting its strengths and areas for improvement.
| Metric | 2023 | 2024 | 2025 |
|---|---|---|---|
| Free Cash Flow Yield | 4.67% | 4.10% | 7.53% |
| Earnings Yield | 7.41% | 7.53% | 5.02% |
| CAPEX to Operating Cash Flow | 50.99% | 54.08% | 33.65% |
| Stock-based Compensation to Revenue | 0.30% | 0.33% | 0.33% |
| Free Cash Flow / Operating Cash Flow Ratio | 49.01% | 45.92% | 66.35% |
The cash flow stability indicated by a favorable free cash flow yield suggests that Best Buy has a robust capacity to manage dividends effectively while maintaining efficient capital expenditure levels.
🔍 Balance Sheet & Leverage Analysis
Strong balance sheet management and leverage efficiency are indicative of a company’s financial stability and ability to withstand market fluctuations. Here, Best Buy illustrates some variability in its leverage metrics.
| Metric | 2023 | 2024 | 2025 |
|---|---|---|---|
| Debt-to-Equity | 142.33% | 130.43% | 144.34% |
| Debt-to-Assets | 25.17% | 26.61% | 27.42% |
| Debt-to-Capital | 58.73% | 56.60% | 59.07% |
| Net Debt to EBITDA | 0.77 | 0.98 | 1.12 |
| Current Ratio | 0.98 | 1.00 | 1.03 |
| Quick Ratio | 0.41 | 0.37 | 0.39 |
| Financial Leverage | 5.65 | 4.90 | 5.26 |
The metrics reveal a consistent leverage strategy, though with a slightly elevated debt-to-equity ratio, which warrants a watchful eye on future borrowings.
🔥 Fundamental Strength & Profitability
Examining the fundamental strengths and profitability metrics of Best Buy provides insight into the company's ability to generate returns and maintain a competitive edge within the sector.
| Metric | 2023 | 2024 | 2025 |
|---|---|---|---|
| Return on Equity | 50.77% | 40.65% | 33.01% |
| Return on Assets | 8.98% | 8.29% | 6.27% |
| Net Margin | 3.06% | 2.86% | 2.23% |
| EBIT Margin | 3.94% | 3.85% | 3.24% |
| EBITDA Margin | 5.92% | 5.97% | 5.33% |
| Gross Margin | 21.41% | 22.10% | 22.60% |
| R&D to Revenue | 0% | 0% | 0% |
Despite fluctuations, Best Buy maintains a robust ROE, suggesting solid profitability and an efficient use of equity capital, though low R&D investment may impact future innovation.
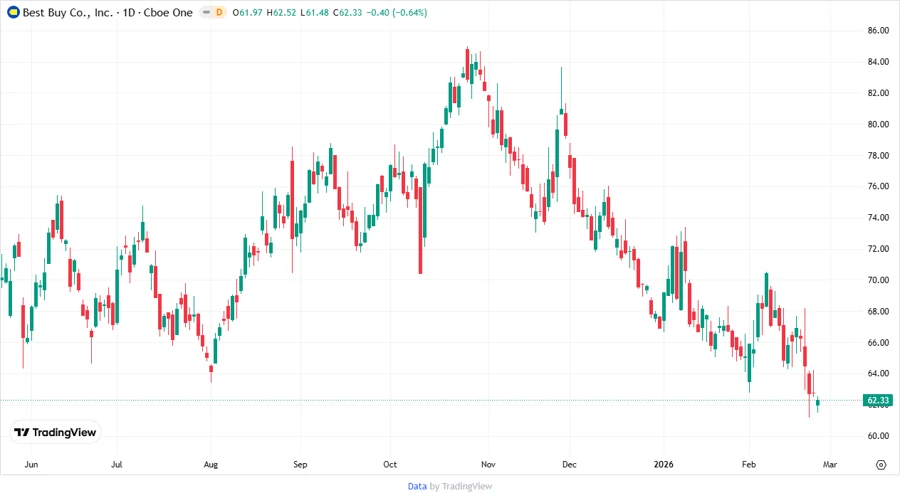
📷 Price Development
✨ Dividend Scoring System
| Criteria | Comment | Score |
|---|---|---|
| Dividend yield | Strong yield above industry average | |
| Dividend Stability | Consistent payout history | |
| Dividend growth | Moderate long-term growth | |
| Payout ratio | High EPS payout raises sustainability concerns | |
| Financial stability | Manageable debt, robust financial health | |
| Dividend continuity | No cuts since 2017 | |
| Cashflow Coverage | Reasonable coverage of dividends | |
| Balance Sheet Quality | Strong leverage ratios, careful management |
Overall Score: 57 out of 80
🔍 Rating
Overall, Best Buy Co., Inc. presents a compelling dividend investment profile with a strong yield and solid history of payouts. However, the elevated EPS payout ratio and moderate growth warrant a cautious but optimistic outlook. While well-positioned in terms of financial health and operational efficiency, future attention should focus on maintaining sustainability amidst evolving market conditions. Recommended as a “Hold” for income-seeking investors with a focus on stability and consistent returns.