October 12, 2025 a 02:46 am

BBY: Dividend Analysis - Best Buy Co., Inc.
Best Buy Co., Inc. presents a robust dividend profile with a current dividend yield of 5.14%. The company has a strong dividend history of 23 consecutive years, emphasizing its commitment to returning value to shareholders. Though the EPS payout ratio exceeds 100%, the free cash flow payout ratio is a more sustainable 58.28%, suggesting potential for continued dividend support. However, investors should remain vigilant to any financial shifts impacting the payout ratios.
Overview 📊
Best Buy operates in the retail sector, prominently known for its consistent dividend payments. The current dividend per share stands at $3.75 with a yield of 5.14%. The company boasts of maintaining dividend payouts for an impressive 23 years.
| Metric | Value |
|---|---|
| Sector | Retail |
| Dividend Yield | 5.14% |
| Current Dividend per Share | $3.75 |
| Dividend History | 23 years |
| Last Cut or Suspension | None |
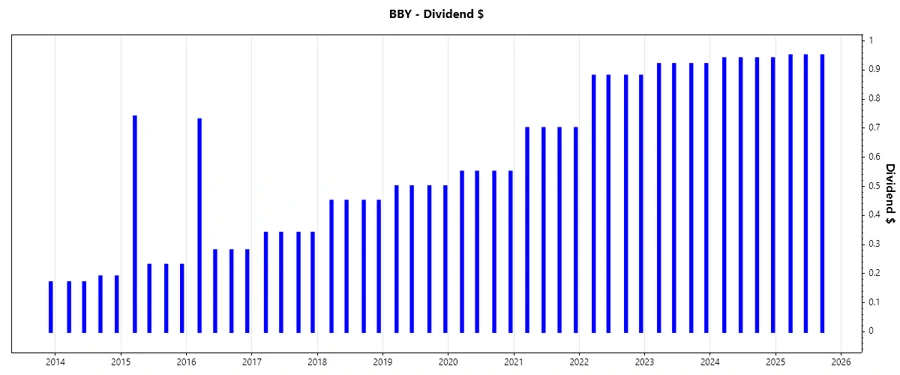
Dividend History 🗣️
The historical dividend data underlines Best Buy's commitment to shareholder returns. Understanding past payments aids in predicting future reliability and growth potential. The consistent growth over the years reflects a stable business model.
| Year | Dividend per Share (USD) |
|---|---|
| 2025 | $2.85 |
| 2024 | $3.76 |
| 2023 | $3.68 |
| 2022 | $3.52 |
| 2021 | $2.8 |
Dividend Growth 📈
Tracking dividend growth over the years reveals the company's financial health and strategic direction. The growth rate is essential for assessing the long-term viability of dividend increases.
| Time | Growth |
|---|---|
| 3 years | 10.33% |
| 5 years | 13.46% |
The average dividend growth is 13.46% over 5 years. This shows moderate but steady dividend growth.
Payout Ratio ⚠️
The payout ratio indicates how much of the company’s earnings and free cash flow is being paid out as dividends, affecting future growth and investor returns.
| Key Figure | Ratio |
|---|---|
| EPS-based | 102.09% |
| Free cash flow-based | 58.28% |
The EPS payout ratio of 102.09% is quite high, suggesting dividends exceed earnings. However, a more sustainable position is reflected in the free cash flow payout ratio of 58.28%, mitigating short-term concerns.
Cashflow & Capital Efficiency ✅
Cashflow and capital efficiency metrics provide insights into operational performance and ability to invest for future growth.
| Metric | 2023 | 2024 | 2025 |
|---|---|---|---|
| Free Cash Flow Yield | 4.67% | 4.10% | 7.53% |
| Earnings Yield | 7.41% | 7.53% | 5.02% |
| CAPEX to Operating Cash Flow | 50.99% | 54.08% | 33.65% |
| Stock-based Compensation to Revenue | 0.30% | 0.33% | 0.33% |
| Free Cash Flow / Operating Cash Flow Ratio | 49.01% | 45.92% | 66.35% |
The robust free cash flow yield and ratios above 50% reflect healthy cash generation supporting dividend continuation, while maintaining strategic reinvestment opportunities.
Balance Sheet & Leverage Analysis 📉
A strong balance sheet with proper leverage ratios is crucial for sustaining dividend payments and supporting future growth.
| Metric | 2023 | 2024 | 2025 |
|---|---|---|---|
| Debt-to-Equity | 1.42 | 1.30 | 1.44 |
| Debt-to-Assets | 25.17% | 26.60% | 27.42% |
| Debt-to-Capital | 58.73% | 56.60% | 59.07% |
| Net Debt to EBITDA | 0.77 | 0.98 | 1.12 |
| Current Ratio | 0.98 | 1.00 | 1.03 |
| Quick Ratio | 0.41 | 0.37 | 0.39 |
| Financial Leverage | 5.65 | 4.90 | 5.26 |
While Best Buy exhibits high leverage, the satisfactory current and quick ratios with decreasing net debt to EBITDA reflect adequate financial health and liquidity stability to cover obligations.
Fundamental Strength & Profitability 📈
Reviewing ROE, margins and R&D investment clarifies economic value creation to support sustained dividend increases and capital gains.
| Metric | 2023 | 2024 | 2025 |
|---|---|---|---|
| Return on Equity | 50.77% | 40.65% | 33.01% |
| Net Profit Margin | 3.06% | 2.86% | 2.23% |
| EBIT Margin | 3.94% | 3.85% | 3.24% |
| EBITDA Margin | 5.92% | 5.97% | 5.33% |
| Gross Profit Margin | 21.41% | 22.10% | 22.60% |
| R&D to Revenue | 0% | 0% | 0% |
Strong profitability reflected in high ROE suggests efficient utilization of shareholder capital. Despite no R&D expenditure, sustained gross margins indicate potential to maintain competitive positioning.
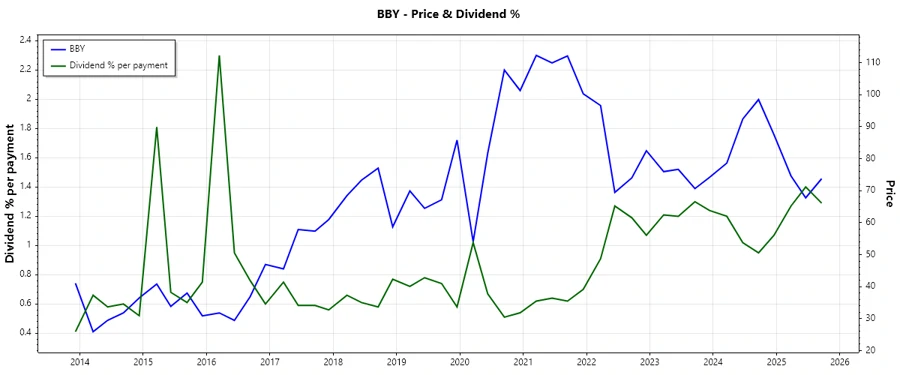
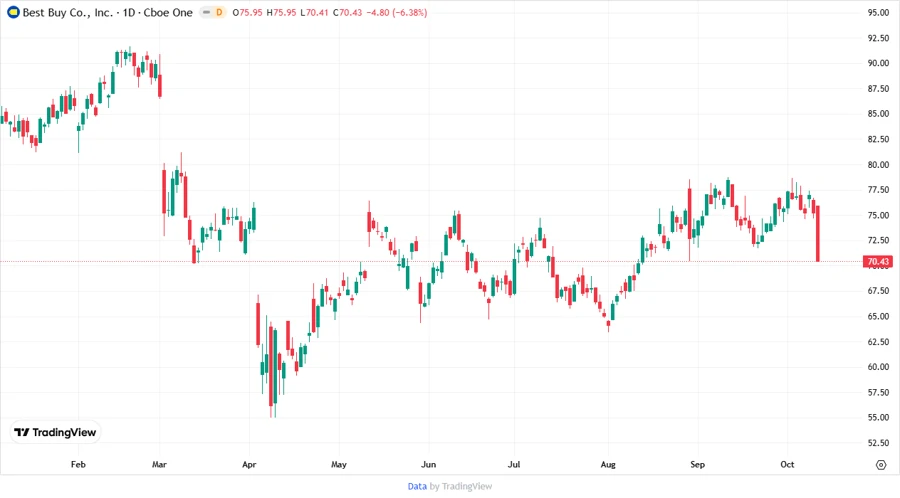
Price Development 📉
Dividend Scoring System 💼
| Criterion | Score | |
|---|---|---|
| Dividend yield | 4 | |
| Dividend Stability | 5 | |
| Dividend Growth | 4 | |
| Payout Ratio | 3 | |
| Financial Stability | 3 | |
| Dividend Continuity | 5 | |
| Cashflow Coverage | 4 | |
| Balance Sheet Quality | 3 |
Total Score: 31/40
Rating 🚀
Best Buy Co., Inc. demonstrates a commitment to maintaining solid dividends with continued growth potential, albeit with a careful eye on balance sheet leverage. It remains a stable choice for investors seeking yield, supported by significant years of consistent dividend payouts and moderate growth.
Smart Data Insight
Master the Perfect Entry & Exit for this Stock
Don't leave your profits to chance. Historically, this stock follows specific seasonal patterns that institutional traders use to maximize returns.
- ✅ Identify the "Golden Buying Window"
- ✅ Avoid high-risk correction cycles
- ✅ Backtested data from the last 20+ years