
July 01, 2026 a 03:15 am
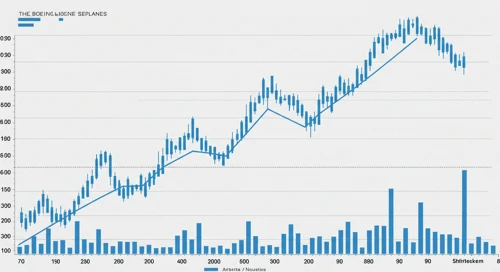


BA: Trend and Support & Resistance Analysis - The Boeing Company
The Boeing Company (Ticker: BA) operates as a global aerospace leader. The company designs and manufactures commercial jetliners and defense, space, and security systems, providing after-sales support services. Recent price analysis of Boeing's stock illustrates a mixed trend with a predominant sideways movement. This analysis will delve into the latest price trends, support and resistance zones, and provide a detailed technical perspective. Investors should pay careful attention to these insights for future decision-making.
Trend Analysis
| Date | Close Price | Trend |
|---|---|---|
| 2026-06-30 | 216.47 | ⚖️ Sideways |
| 2026-06-29 | 214.69 | ⚖️ Sideways |
| 2026-06-26 | 217.25 | ⚖️ Sideways |
| 2026-06-25 | 218.12 | ⚖️ Sideways |
| 2026-06-24 | 220.25 | ⚖️ Sideways |
| 2026-06-23 | 216.71 | ⚖️ Sideways |
| 2026-06-22 | 220.83 | ⚖️ Sideways |
The EMA20 and EMA50 trends show close proximity, indicating a sideways trend over the past days. This suggests a temporary equilibrium in investor sentiment, with neither bulls nor bears taking decisive control.
Support and Resistance
| Type | Zone From | Zone To |
|---|---|---|
| Support Zone 1 | 210.00 | 215.00 |
| Support Zone 2 | 200.00 | 205.00 |
| Resistance Zone 1 | 225.00 | 230.00 |
| Resistance Zone 2 | 235.00 | 240.00 |
The current price is in a support zone between 210.00 and 215.00, suggesting potential support for further price declines. If the price holds above this zone, a rebound towards resistance levels may occur.
Conclusion
Boeing's stock currently exhibits a sideways trend with the potential for breakout movements. The support and resistance zones identified provide a framework for potential price movements. Investors should consider the current zones when strategizing entry and exit positions. Continued attention to trend movements and market conditions will be crucial for making informed decisions. While Boeing is stable within identified zones, changes in market conditions or company outlook could shift current perceptions. Analysts should remain vigilant for any changes that may impact these technical observations.
Smart Data Insight
Master the Perfect Entry & Exit for this Stock
Don't leave your profits to chance. Historically, this stock follows specific seasonal patterns that institutional traders use to maximize returns.
- ✅ Identify the "Golden Buying Window"
- ✅ Avoid high-risk correction cycles
- ✅ Backtested data from the last 20+ years