October 02, 2025 a 03:16 pm
BA: Fibonacci Analysis - The Boeing Company
The Boeing Company stock has shown significant movements over the last few months, characterized by a prevalent downward trend. As the company operates across various segments including commercial airplanes and defense systems, its stock remains a key player in the aerospace sector. The recent trend observed indicates potential retracement opportunities which are crucial for investors to analyze potential entry and exit points.
Fibonacci Analysis
| Analysis Info | Details |
|---|---|
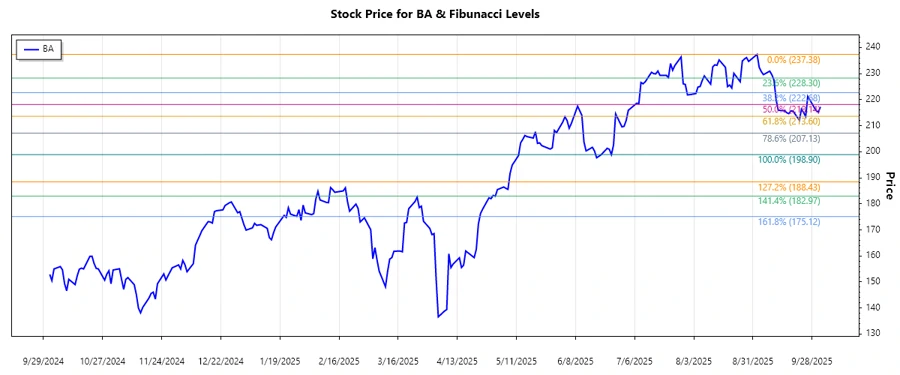
| Trend Start Date | 2025-06-24 |
| Trend End Date | 2025-09-26 |
| High Point (Price & Date) | $237.38 on 2025-09-02 |
| Low Point (Price & Date) | $198.9 on 2025-06-25 |
Fibonacci Levels
| Level | Price |
|---|---|
| 0.236 | $208.90 |
| 0.382 | $215.89 |
| 0.5 | $218.14 |
| 0.618 | $224.39 |
| 0.786 | $230.41 |
Currently, the stock is trading at $217.2154, which indicates it is within the 0.382 Fibonacci retracement level. This suggests a potential area of support where the price might consolidate before possibly moving upwards. Investors should watch these levels closely as they may indicate possible entry points or areas of resistance and support.
Conclusion
The Boeing Company's recent stock price movements have shown a downward trend with a strong retracement to the 0.382 level, suggesting potential bullish opportunities for investors. However, caution is advised due to the volatile nature of the aviation and defense sectors. Boeing's diverse operations could provide resilience, but market conditions and geopolitical tensions could pose risks. With careful analysis using the identified Fibonacci levels, investors might capitalize on strategic opportunities within this range.
Smart Data Insight
Master the Perfect Entry & Exit for this Stock
Don't leave your profits to chance. Historically, this stock follows specific seasonal patterns that institutional traders use to maximize returns.
- ✅ Identify the "Golden Buying Window"
- ✅ Avoid high-risk correction cycles
- ✅ Backtested data from the last 20+ years