
July 15, 2026 a 11:31 am
BAX: Dividend Analysis - Baxter International Inc.
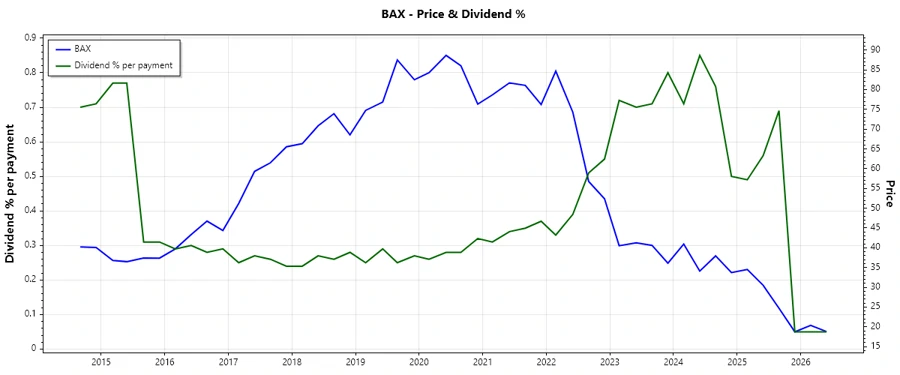
Baxter International Inc. has a notable dividend history spanning 45 years, which is indicative of its commitment to returning value to shareholders. Despite recent challenges in dividend growth, with both 3-year and 5-year growth rates being negative, the company has never cut or suspended dividends. This showcases a strong historical pattern of dividend stability.
📊 Overview
Baxter International Inc. offers a dividend yield of 1.06%, with a current dividend per share of $0.68 USD. The company's dividend history of 45 years underscores its dedication to maintaining shareholder distributions. Remarkably, there has been no recorded instance of a dividend cut or suspension recently.
| Detail | Value |
|---|---|
| Sector | Not provided |
| Dividend yield | 1.06 % |
| Current dividend per share | $0.68 |
| Dividend history | 45 years |
| Last cut or suspension | None |
📈 Dividend History
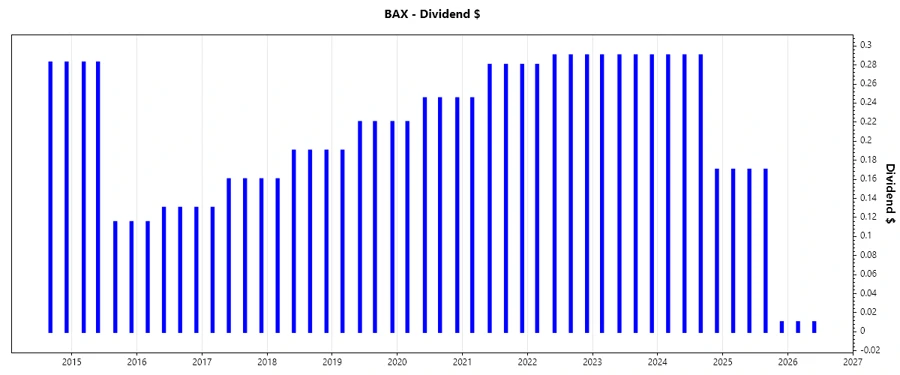
The track record of dividend payments is a crucial indicator of a company's reliability and commitment to shareholder returns. Baxter International's 45-year history of uninterrupted payments stands out as a beacon of stability.
| Year | Dividend per Share (USD) |
|---|---|
| 2026 | $0.02 |
| 2025 | $0.52 |
| 2024 | $1.04 |
| 2023 | $1.16 |
| 2022 | $1.15 |
📈 Dividend Growth
Dividend growth is essential for validating a company’s capability to increase shareholder returns over time. While Baxter has had a recent decline in growth, understanding the percentages over 3 and 5 years is critical.
| Time | Growth |
|---|---|
| 3 years | -23.25 % |
| 5 years | -11.45 % |
The average dividend growth is -11.45 % over 5 years. This shows moderate but steady dividend growth.
📊 Payout Ratio
The payout ratio serves as a critical measure of dividend sustainability from earnings and cash flow. With a negative EPS payout ratio, there are concerns regarding earnings covering dividends. However, the free cash flow-based payout ratio is more conservative.
| Key figure | Ratio |
|---|---|
| EPS-based | -31.82 % |
| Free cash flow-based | 49.07 % |
The negative EPS payout ratio highlights potential risks, whereas the moderate FCF ratio indicates a more prudent cash flow strategy for sustaining dividends.
📉 Cashflow & Capital Efficiency
Cash flow and capital allocation are critical for ensuring a company's operational flexibility and ability to fund dividends. The ratios emphasize cash generation ability and efficiency in capital use.
| Metric | 2025 | 2024 | 2023 |
|---|---|---|---|
| Free Cash Flow Yield | 3.29 % | 3.76 % | 6.59 % |
| Earnings Yield | -9.76 % | -4.36 % | 13.58 % |
| CAPEX to Operating Cash Flow | 61.78 % | 45.14 % | 25.26 % |
| Stock-based Compensation to Revenue | 1.04 % | 1.07 % | 1.11 % |
| Free Cash Flow / Operating Cash Flow Ratio | 38.22 % | 54.86 % | 74.74 % |
These cash flow metrics highlight the company's ability to fund operations efficiently and evaluate capital usage strategically.
📊 Balance Sheet & Leverage Analysis
Assessing a company's leverage is essential to understanding its long-term solvency and financial health. The balance sheet ratios provide context on debt risks.
| Metric | 2025 | 2024 | 2023 |
|---|---|---|---|
| Debt-to-Equity | 1.63 | 1.93 | 1.68 |
| Debt-to-Assets | 49.88 % | 52.16 % | 49.91 % |
| Debt-to-Capital | 62.01 % | 65.88 % | 62.68 % |
| Net Debt to EBITDA | 10.49 | 10.47 | 6.36 |
| Current Ratio | 1.56 | 1.36 | 1.48 |
| Quick Ratio | 1.56 | 1.05 | 1.18 |
| Financial Leverage | 3.27 | 3.70 | 3.37 |
The parameters suggest Baxter’s moderate leverage, but a strong net debt to EBITDA ratio implies potential debt service challenges.
📊 Fundamental Strength & Profitability
An understanding of fundamental health and profitability provides clearer insight into long-term strategies and operational efficiencies.
| Metric | 2025 | 2024 | 2023 |
|---|---|---|---|
| Return on Equity | -15.61 % | -9.32 % | 31.61 % |
| Return on Assets | -4.77 % | -2.52 % | 9.39 % |
| Margins: Net | -8.51 % | -6.10 % | 25.64 % |
| Margins: EBIT | -1.91 % | 1.12 % | 7.24 % |
| Margins: EBITDA | 6.81 % | 10.49 % | 16.74 % |
| Margins: Gross | 30.05 % | 37.46 % | 40.06 % |
| Research & Development to Revenue | 4.61 % | 5.55 % | 5.00 % |
Baxter's mixed fundamental performance highlights areas of strength, such as strong gross margins, contrasted by negative net and EBIT margins in recent years.
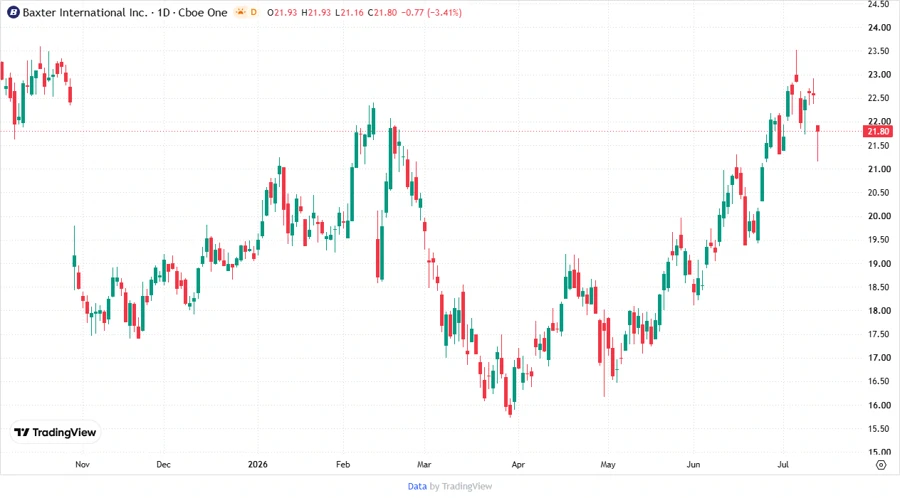
📈 Price Development
📊 Dividend Scoring System
| Criterion | Score | Bar |
|---|---|---|
| Dividend yield | 2 | |
| Dividend Stability | 4 | |
| Dividend growth | 1 | |
| Payout ratio | 3 | |
| Financial stability | 3 | |
| Dividend continuity | 5 | |
| Cashflow Coverage | 3 | |
| Balance Sheet Quality | 3 |
Overall Score: 24 out of 40
🗣️ Rating
Baxter International Inc. demonstrates a resilient dividend strategy despite recent concerns regarding growth and leverage. With a rich history of dividend payments and moderate overall financial health, it commands a niche position in dividend investing. However, potential investors should heed the negative payout ratios and debt levels when considering this stock for dividend income strategies.
Smart Data Insight
Master the Perfect Entry & Exit for this Stock
Don't leave your profits to chance. Historically, this stock follows specific seasonal patterns that institutional traders use to maximize returns.
- ✅ Identify the "Golden Buying Window"
- ✅ Avoid high-risk correction cycles
- ✅ Backtested data from the last 20+ years