April 20, 2026 a 09:03 am


BALL: Trend and Support & Resistance Analysis - Ball Corporation
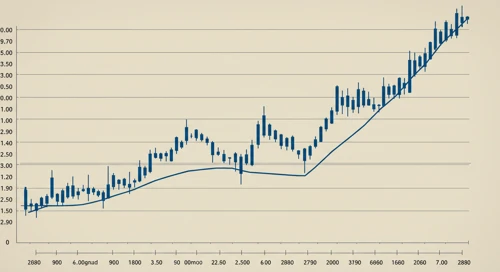
The Ball Corporation, mainly operating in the aluminum packaging sector, has shown a mixed trend over the recent months based on its stock performance. The technical analysis reveals varied movements with a recent upward momentum. The stock's performance is influenced by the aluminum market dynamics and global demand in packaging. Considering the aerospace sector's involvement, the stock may show volatility based on defense contracts and technological advancements.
Trend Analysis
| Date | Close Price | Trend |
|---|---|---|
| 2026-04-17 | $64.48 | ▲ Uptrend |
| 2026-04-16 | $63.37 | ▲ Uptrend |
| 2026-04-15 | $62.76 | ▲ Uptrend |
| 2026-04-14 | $63.51 | ▲ Uptrend |
| 2026-04-13 | $63.60 | ▲ Uptrend |
| 2026-04-10 | $62.29 | ▲ Uptrend |
| 2026-04-09 | $62.87 | ▲ Uptrend |
Currently, the EMA20 is greater than the EMA50, indicating a consistent upward trend. This positive trend is a signal for potential bullish movements if the trend continues, suggesting investors to consider buy opportunities.
Support and Resistance
| Zone Type | From | To |
|---|---|---|
| Support Zone 1 | $59.11 | ▲ $59.97 |
| Support Zone 2 | $56.87 | ▲ $57.36 |
| Resistance Zone 1 | $64.78 | ▼ $66.42 |
| Resistance Zone 2 | $66.63 | ▼ $67.29 |
Currently, the stock price is near the lower resistance zone, indicating possible downward pressure unless strong buying interest emerges. Breaking through this level could lead to further gains or retracement based on investor sentiment.
Conclusion
The Ball Corporation's stock displays a mildly upward trajectory in its current phase. The prevailing uptrend, supported by calculated moving averages, suggests a positive outlook, but the presence of significant resistance may challenge further price increases. Investors should be vigilant in observing price actions around the identified zones to assess short-term moves and trading opportunities. Overall, while the aerospace sector adds volatility, the stable demand in aluminum packaging offers potential security in value.