May 21, 2026 a 10:15 am
BALL: Fibonacci Analysis - Ball Corporation
Ball Corporation, with its broad global reach in aluminum packaging and aerospace technology, has experienced fluctuations in stock prices. Recently, the market has displayed varied movements, reflecting the company's resilience in facing competitive pressures in its core markets. Investors should consider this dynamic outlook while evaluating potential stock investments.
Fibonacci Analysis
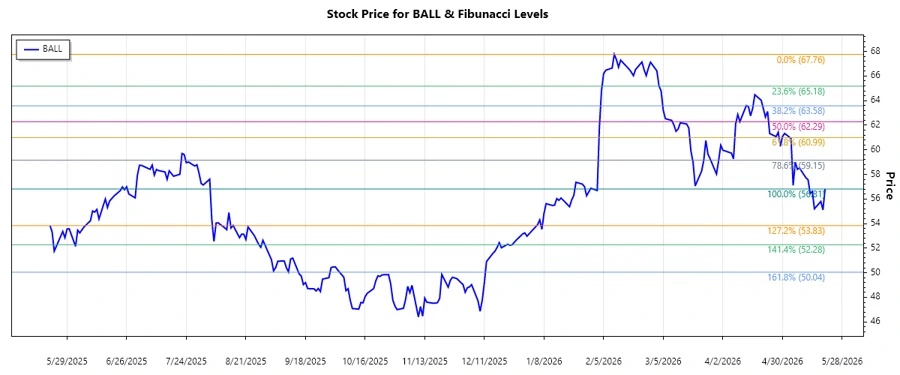
The recent trend of Ball Corporation’s stock is a dominant downtrend starting from February 11, 2026, with a high of $67.76, and reaching a low of $56.81 by May 20, 2026. As part of our Fibonacci analysis, we calculate key levels to predict potential support or resistance. These Fibonacci levels are instrumental in identifying probable reversal zones in the stock price.
| Parameter | Details |
|---|---|
| Start Date | 2026-02-11 |
| End Date | 2026-05-20 |
| High Point (Price/Date) | $67.76 on 2026-02-11 |
| Low Point (Price/Date) | $56.81 on 2026-05-20 |
| Fibonacci Level | Price Level |
|---|---|
| 0.236 | $64.97 |
| 0.382 | $63.39 |
| 0.5 | $62.29 |
| 0.618 | $61.19 |
| 0.786 | $59.58 |
The current price sits at $56.81, which is below the 0.786 retracement level. This suggests potential further downtrend momentum unless the price rebounds towards the Fibonacci levels. Staying below $59.58 poses a risk of further decline, though it also provides an opportunity for support near this zone if a reversal commences.
Conclusion
Ball Corporation's stock shows a recent downtrend as indicated by current analysis using Fibonacci retracement levels. While the downward momentum poses a risk for short-term depreciation, it may also offer buying opportunities at lower support levels for long-term investors. The company continues to possess strong potential in its core areas of aluminum packaging and aerospace technology. As analysts monitor these developments, maintaining a cautious yet forward-looking investment strategy is advised, balancing potential rewards with existing market risks.
Smart Data Insight
Master the Perfect Entry & Exit for this Stock
Don't leave your profits to chance. Historically, this stock follows specific seasonal patterns that institutional traders use to maximize returns.
- ✅ Identify the "Golden Buying Window"
- ✅ Avoid high-risk correction cycles
- ✅ Backtested data from the last 20+ years