July 22, 2025 a 04:03 am

BAC: Trend and Support & Resistance Analysis - Bank of America Corporation
Bank of America Corporation, with its global presence and diverse financial offerings, continues to demonstrate resilience in varying market conditions. The stock's recent performance, although subject to market volatility, reflects a gradual upward momentum. Investors are keenly observing its technical indicators, particularly given its strategic positioning within the banking and financial sectors, which are poised for growth. While there are both opportunities and risks in the current economic environment, BAC's strong customer base and innovative financial solutions contribute positively to its long-term outlook.
Trend Analysis
Analysis of the historic price data for Bank of America Corporation reveals a generally positive trend over the observation period. To accurately gauge the momentum, we calculated the 20-day and 50-day Exponential Moving Averages (EMAs). The intersecting trends provide insight into current market perceptions and sentiment towards the stock.
| Date | Close Price | Trend |
|---|---|---|
| 2025-07-21 | 47.48 | ▲ (EMA20 > EMA50) |
| 2025-07-18 | 47.32 | ▲ (EMA20 > EMA50) |
| 2025-07-17 | 47.02 | ▲ (EMA20 > EMA50) |
| 2025-07-16 | 46.03 | ▲ (EMA20 > EMA50) |
| 2025-07-15 | 46.15 | ▲ (EMA20 > EMA50) |
| 2025-07-14 | 47.07 | ▲ (EMA20 > EMA50) |
| 2025-07-11 | 46.73 | ▲ (EMA20 > EMA50) |
The consistent display of the upward trend in recent data suggests strong bullish sentiment among investors. The intersecting moving averages indicate a robust upward momentum, driven by confidence in BAC's market strategy and adaptability.
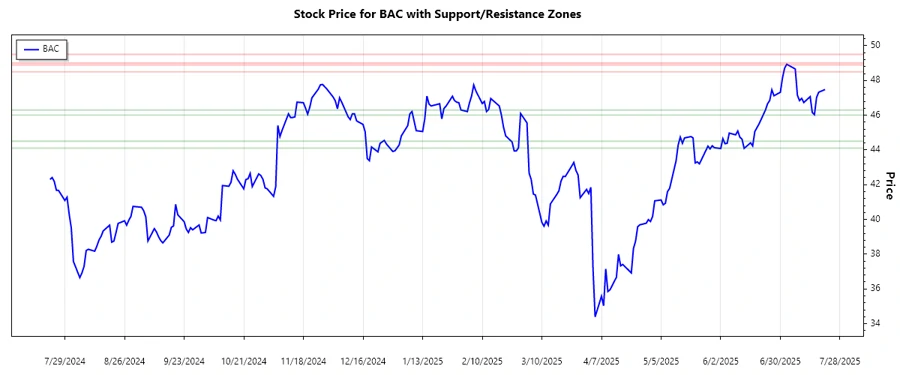
Support and Resistance
Identifying pivotal support and resistance zones offers valuable insights into potential price reversals or breakthroughs. These zones denote areas where the stock might encounter buying or selling pressures.
| Zone Type | From | To | Indicator |
|---|---|---|---|
| Support 1 | 44.10 | 44.50 | ⬇️ |
| Support 2 | 46.00 | 46.30 | ⬇️ |
| Resistance 1 | 48.50 | 48.90 | ⬆️ |
| Resistance 2 | 49.00 | 49.50 | ⬆️ |
The stock's current position is nearing a resistance zone which could act as a potential barrier for upward price movement unless breached with substantial trading volume. Conversely, the identified support levels suggest brisk buying interest if the price retraces to these zones.
Overall, Bank of America Corporation stands on a firm foundation despite volatile economic conditions. While support and resistance levels provide context for trader actions, the prevailing upward trend suggests investor confidence. Moving forward, investors should be mindful of shifts in external economic indicators that may influence market sentiment. Balancing the appreciation potential against potential economic headwinds remains crucial for long-term investment strategies. BAC's steadfast market presence coupled with responsive financial solutions positions it well amidst emerging financial landscapes.
Smart Data Insight
Master the Perfect Entry & Exit for this Stock
Don't leave your profits to chance. Historically, this stock follows specific seasonal patterns that institutional traders use to maximize returns.
- ✅ Identify the "Golden Buying Window"
- ✅ Avoid high-risk correction cycles
- ✅ Backtested data from the last 20+ years